SNEAK PEEK
- Polygon price analysis shows a decline in price action.
- MATIC sought support at the $0.7809 level.
- Resistance for MATIC is present at $0.852
The latest Polygon price analysis shows a decline in price action. At the time of writing, MATIC is trading at $0.8161 with a daily loss of 4.06%. The coin has dropped from its recent high at the $0.8622 level and is seeking support around the $0.7809 mark. The bears are dominating the market, but there may be a reversal in sight.
On the upside, there is strong resistance for MATIC at the $0.852 level, and a close above this point could see prices move toward the high of $0.9000. The support level of $0.7809 is acting as an immediate point of pullback. If the bears persist, prices will drop to $0.7500.
The market capitalization of Polygon is currently $7.60 billion, and the 24-hour trading volume stands at $430 million. The market cap and daily trading volume have decreased by 4.02% and 59.21%, respectively, over the past 24 hours. Polygon (MATIC) is currently ranked 10th on CoinMarketCap’s list of the largest cryptocurrencies by market capitalization and has a circulating supply of 9.31 billion MATIC coins.

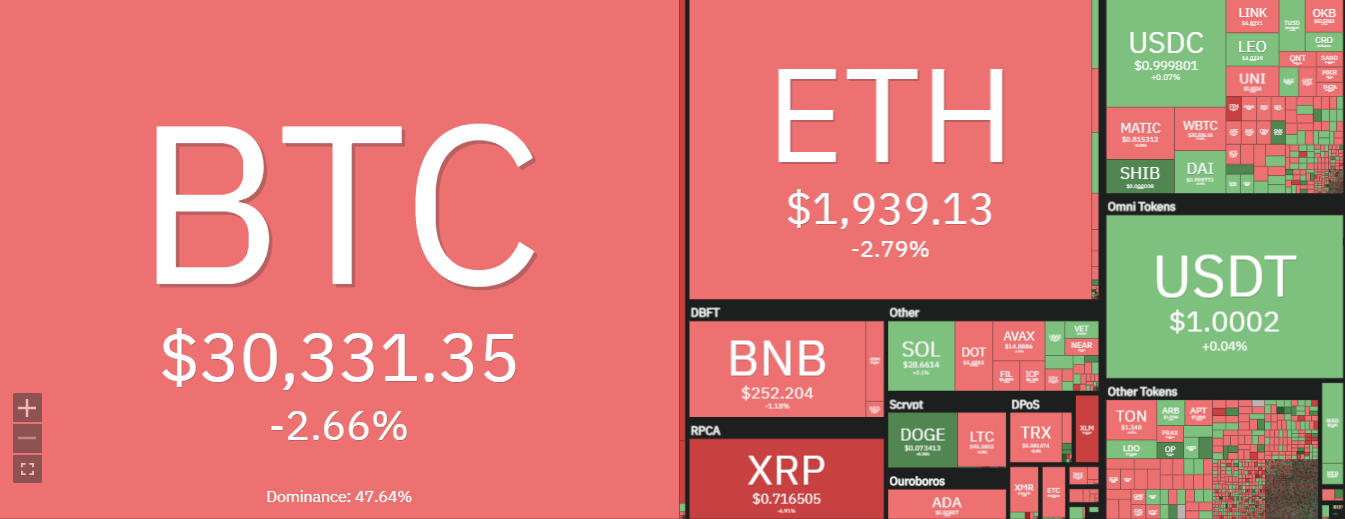
The crypto market has been experiencing a bearish trend in the past 24 hours, and Polygon is no exception. Major coins, including Bitcoin, Ethereum, and Binance Coin, have seen a decrease in their prices. If the bearish trend persists, the selling pressure on Polygon might continue, and the general market mood will probably have an impact in the upcoming days.
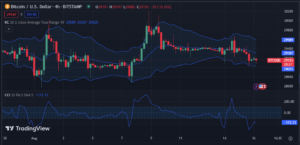
Looking at the 4-hour chart, we can see that MATIC is in a bearish trend. MATIC has broken out of the ascending triangle pattern, a bearish sign. The sellers are in control, and if they remain so, the price could sink further.
Technical indicators in this timeframe show that MATIC is in a bearish zone. The MACD has formed a bearish crossover, and the RSI trades at 59.25, indicating more room for the downside. The bearish momentum will strengthen if the RSI drops below the 50 index.
The Moving Average Convergence Divergence (MACD) indicator has turned bearish, with the MACD line moving below the signal line in the 4-hour chart. This indicates that the bears could gain further control and lower MATIC’s price to $0.7000. The Bollinger band has remained wide, but the price faced rejection at the upper band, retreating towards the middle band.
To conclude, MATIC is currently in a bearish market, and the bears have controlled the market. If the selling pressure persists, prices could retest the $0.7500 level. However, if buyers enter the fray and push prices above $0.852, MATIC could hit the $0.9000 mark.
Disclaimer: Cryptocurrency price is highly speculative and volatile and should not be considered financial advice. Past and current performance is not indicative of future results. Always research and consult with a financial advisor before making investment decisions.
- SEO Powered Content & PR Distribution. Get Amplified Today.
- PlatoData.Network Vertical Generative Ai. Empower Yourself. Access Here.
- PlatoAiStream. Web3 Intelligence. Knowledge Amplified. Access Here.
- PlatoESG. Automotive / EVs, Carbon, CleanTech, Energy, Environment, Solar, Waste Management. Access Here.
- BlockOffsets. Modernizing Environmental Offset Ownership. Access Here.
- Source: https://investorbites.com/polygon-matic-price-analysis-15-07/
- :has
- :is
- :not
- 1
- 10
- 10th
- 22
- 24
- 25
- 31
- 50
- 60
- 7
- 9
- a
- above
- acting
- Action
- advice
- advisor
- ahead
- always
- an
- analysis
- and
- ARE
- around
- AS
- At
- average
- BAND
- BE
- bearish
- Bearish Momentum
- Bears
- been
- before
- below
- Billion
- binance
- Binance Coin
- Bitcoin
- Broken
- but
- buyers
- by
- CAN
- cap
- capitalization
- Chart
- circulating
- Close
- Coin
- Coins
- conclude
- considered
- continue
- control
- controlled
- Convergence
- could
- cryptocurrencies
- cryptocurrency
- Cryptocurrency Price
- Current
- Currently
- daily
- daily trading
- Days
- decisions
- Decline
- decrease
- discussion
- Divergence
- Dominate
- downside
- Drop
- dropped
- Drops
- Enter
- ethereum
- exception
- experiencing
- extensive
- external
- faced
- financial
- financial advice
- For
- formed
- from
- further
- future
- Gain
- General
- Have
- High
- highly
- Hit
- HOURS
- However
- HTTPS
- if
- immediate
- Impact
- in
- Including
- index
- indicates
- Indicator
- Indicators
- internal
- investment
- investor
- ITS
- largest
- latest
- Level
- Line
- List
- loss
- lower
- MACD
- major
- Making
- mark
- Market
- Market Cap
- Market Capitalization
- Market News
- Matic
- May..
- Middle
- might
- million
- Momentum
- more
- move
- moving
- moving average
- network
- news
- no
- of
- on
- out
- over
- past
- Pattern
- performance
- persists
- plato
- Plato Data Intelligence
- PlatoData
- Point
- Polygon
- Polygon (MATIC)
- Polygon Price
- Polygon price analysis
- possible
- present
- pressure
- price
- PRICE ACTION
- Price Analysis
- Prices
- probably
- pullback
- Push
- ranked
- recent
- remain
- remained
- research
- Resistance
- respectively
- Results
- Reversal
- Room
- rsi
- see
- seeking
- seen
- Sellers
- Selling
- should
- show
- Shows
- Sight
- sign
- Signal
- So
- sought
- Source
- speculative
- stands
- Strengthen
- strong
- supply
- support
- support level
- that
- The
- their
- There.
- they
- this
- time
- timeframe
- to
- toward
- towards
- trades
- Trading
- trading volume
- Trend
- Turned
- upcoming
- Upside
- volatile
- volume
- we
- What
- What is
- What is bitcoin
- wide
- will
- with
- writing
- zephyrnet


