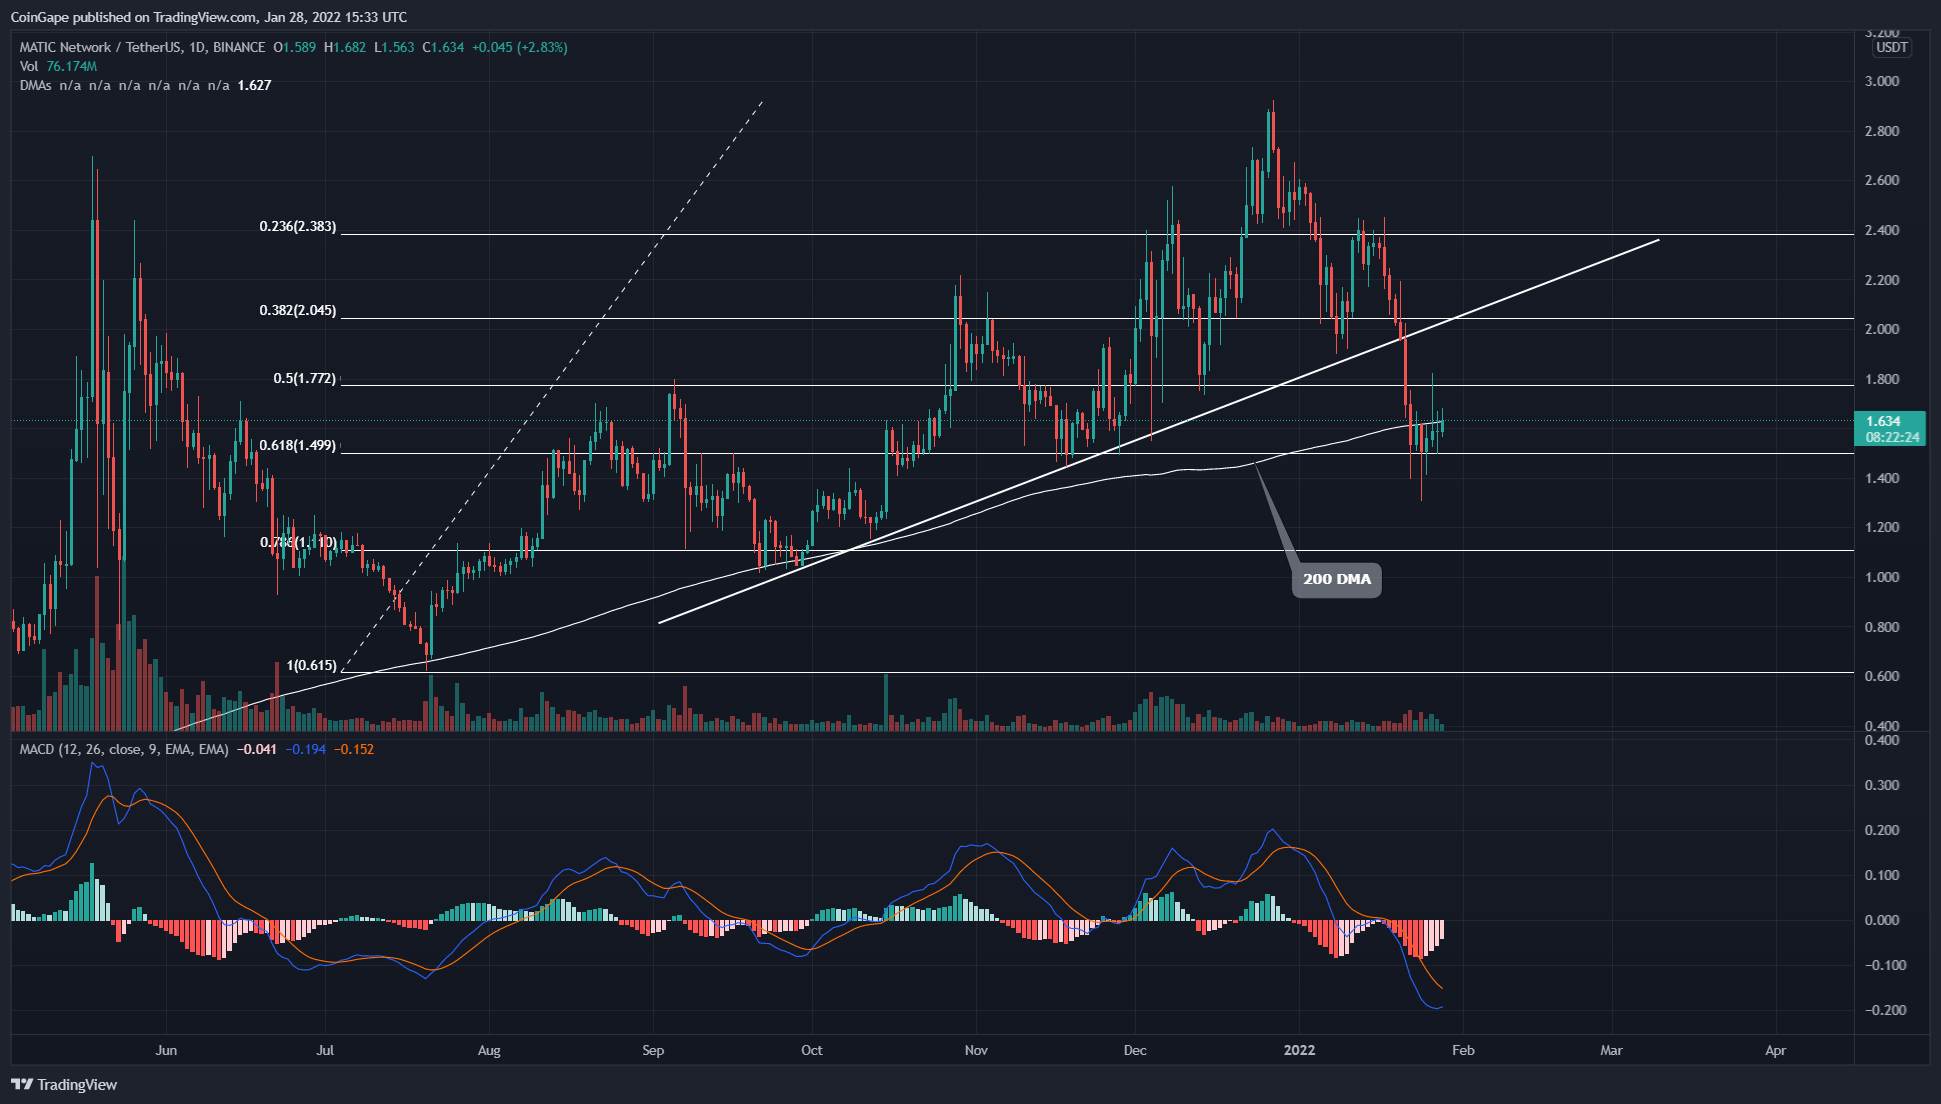
In these last two weeks, MATIC price lost around 30% dropping to the 3-month low of $1.5. The coin hovering above this support shows a few lower price rejection candles, indicating the presence of demand pressure. Can buyers reclaim the 200 DMA or seller will dominate again?.
Key technical element
- The MATIC chart shows a bearish crossover of the 20-and-100-day DMA
- The intraday trading volume in the Polygon coin is $1.5 Billion, indicating a 31% loss.
 Source-Tradingview
In our previous coverage of the Polygon coin, the MATIC/USD pair retested the rising trendline with the hope of a bullish reversal. However, last week’s crypto bloodbath violated this crucial support trendline, causing a 30% devaluation from the fallout point($2).
- The MATIC price plummeted to the three months low support of $1.5, and from last week it is hovering above this support to gather sufficient demand.
- This recent free fall engulfed the 200 EMA line, and the price is currently retesting this flipped resistance. Moreover, the 20 and 100 DMA offers a bearish crossover, encouraging ongoing selling.
- The Moving average convergence divergence remains bearish as the MACD and signal line moving below the neutral zone. However, the distance between these lines is shortening, hinting at a bullish crossover.
MATIC Bulls Need To reclaim $1.78 To Initiate A Recovery Rally
 Source- MATIC/USD chart by Tradingview
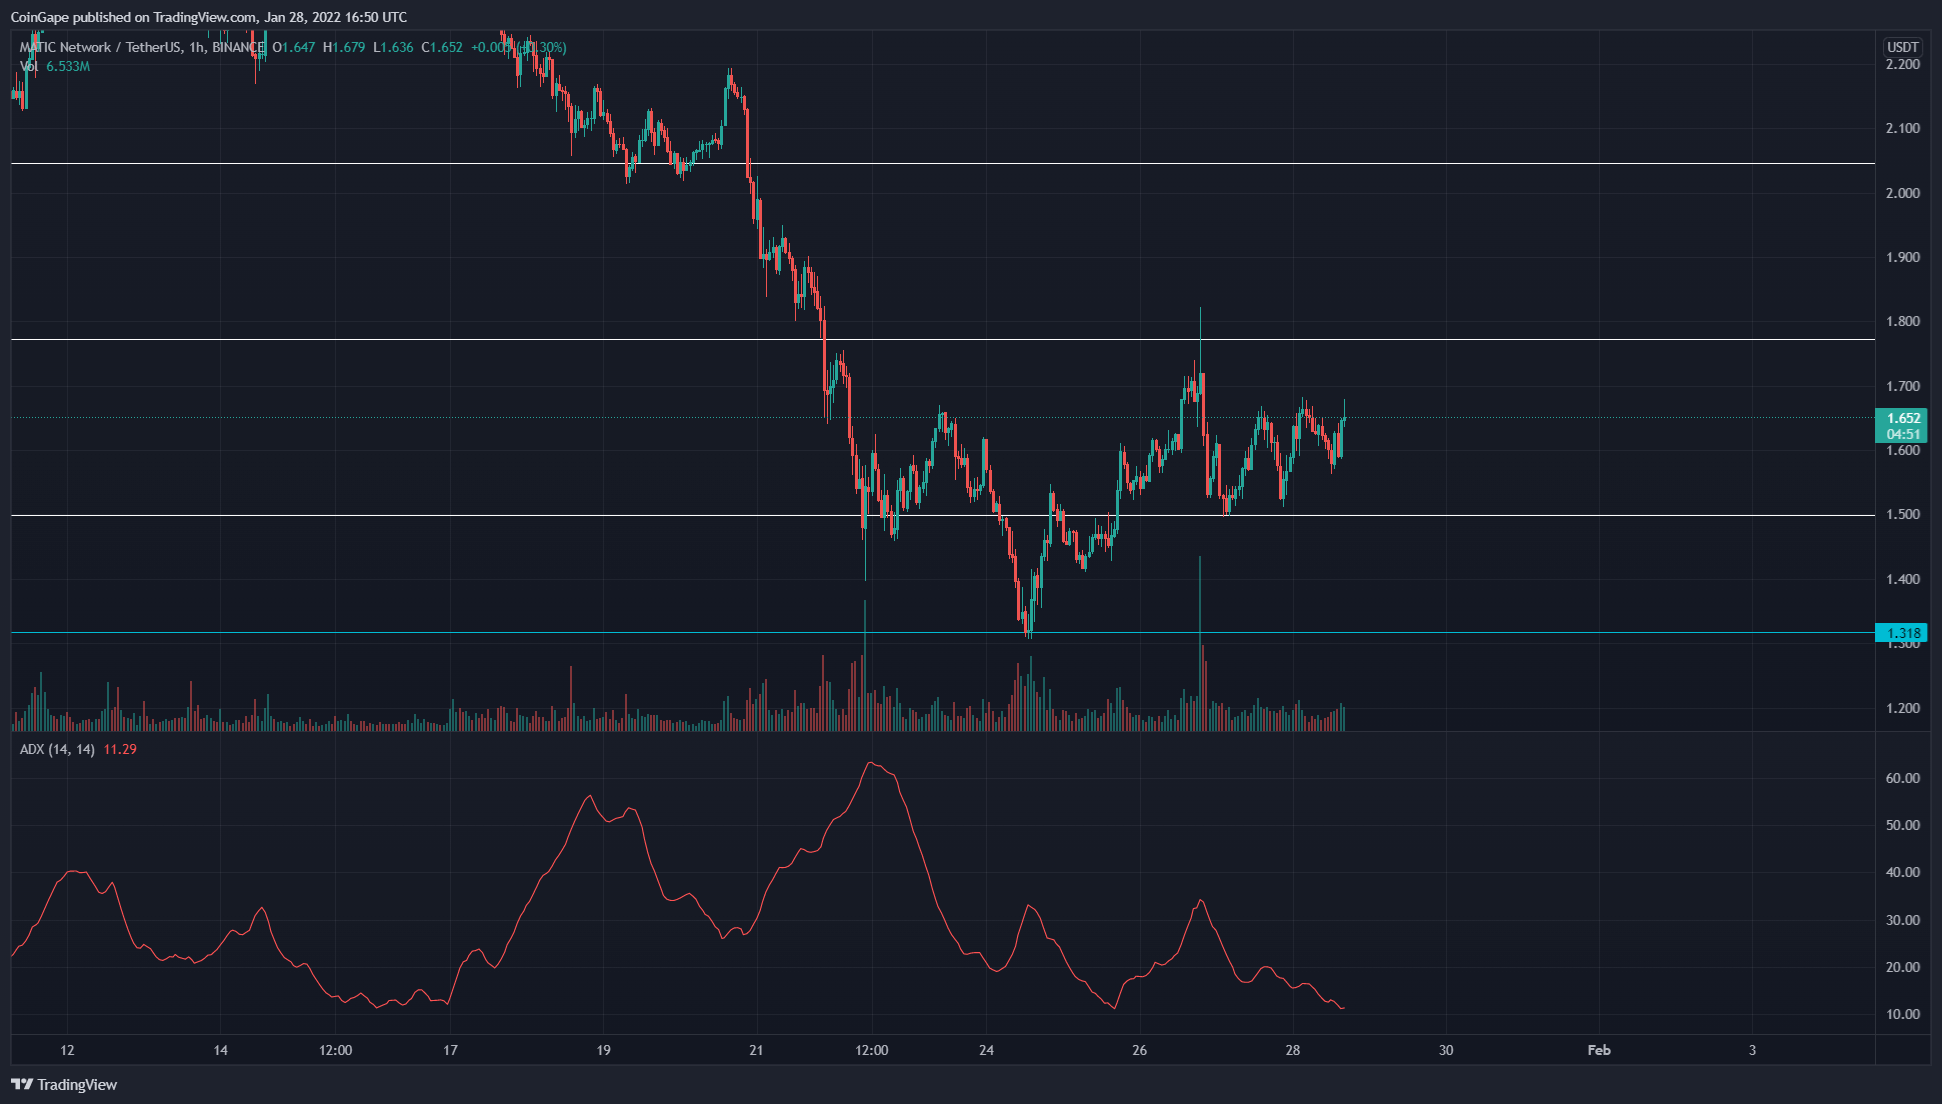
The MATIC price currently trading at $1.66 registers a 23% gain from the new low of $1.32. If the bulls could keep up this momentum, the coin price will breach the nearest resistance of $1.78 and 200-day DMA, indicating a recovery opportunity for long traders.
Moreover, the falling Average Directional Index slope(18), suggests sellers are losing momentum.
The important resistance levels for the coin are $1.78, followed by $2, on the flip side, the support levels are at $1.45 and $1.1.
The post Polygon Price Analysis: MATIC Price Losing 200 DMA Support Suggesting Further Dip appeared first on CoinGape.


