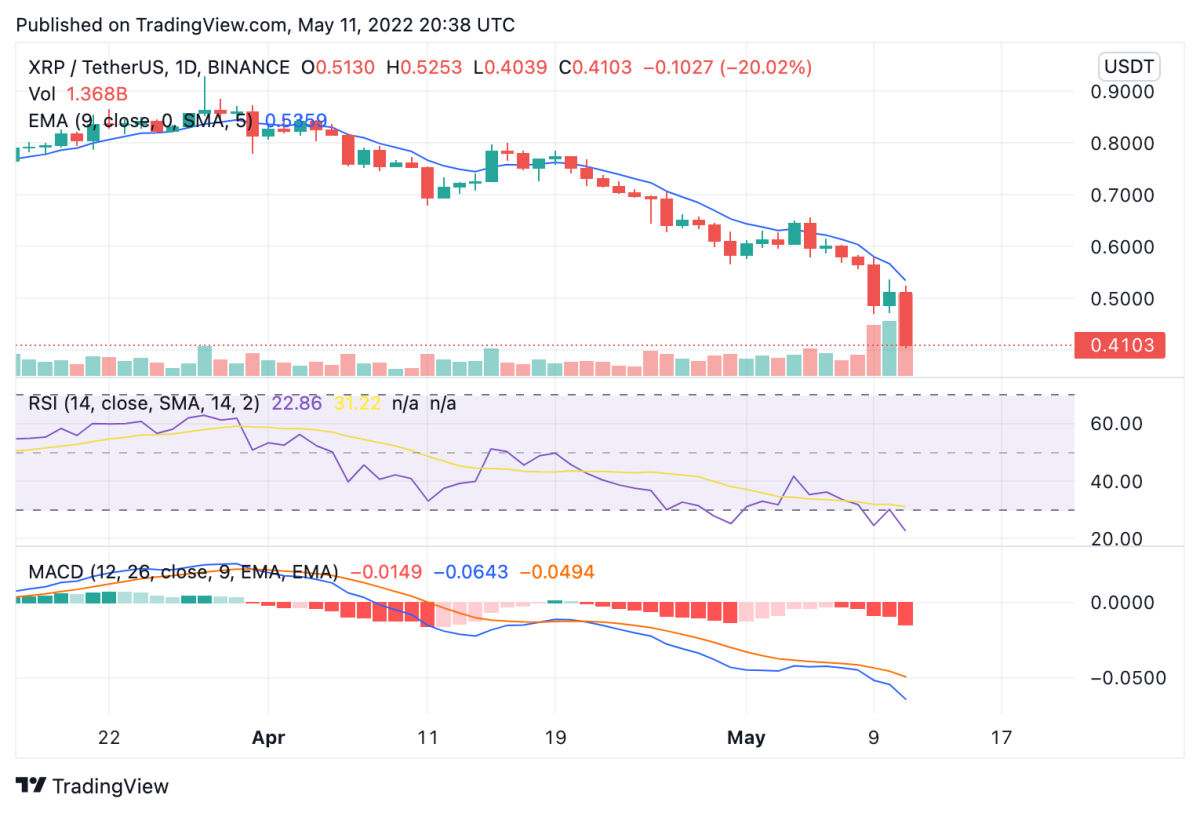
Ripple price analysis continues to show significantly bearish signs as the current trend falls more than 19 percent over the past 24 hours. XRP price has been in free fall since the current decline began on May 7, 2022. After dropping 18 percent on Monday, bears continued to dominate the market for XRP as trading volume rose 27 percent to back the significant price decline over the day’s trade. After dropping further towards the support zone at $0.40, price is expected to undergo further bearish movement towards the lower support zone at $0.25. The current trend is hovering below the 9 and 21-day moving averages. However, movement above these zones over the daily chart could lead the market towards a much needed uptrend.
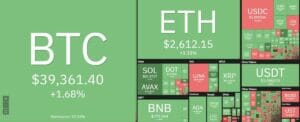
The larger cryptocurrency market portrayed a dismal outlook across the board as major cryptocurrencies dipped into a major decline. Bitcoin fell down to $29,000 with a further 6 percent drop, similar to Ethereum’s 10 percent decline to take price down to $2,100. Among major Altcoins, Cardano suffered a 19 percent crash to move down to $0.52, whereas Dogecoin dropped more than 20 percent down to $0.08. Solana and Polkadot dropped 28 and 24 percent, respectively, to move as low as $48.05 and $8.64, respectively.

Ripple price analysis: RSI moves into severe oversold territory on daily chart
On the 24-hour candlestick chart for Ripple price analysis, price can be seen continuing along a descending triangular pattern to confirm a 19 percent decline over the day’s trade. XRP price reflects an overall bearish sentiment in the cryptocurrency market, which on the other hand provides buyers to move quickly if price drops below the current support level at $0.40. The crucial 50-day exponential moving average (EMA) sits at $0.53 and would present an immediate upper target for XRP.

The 24-hour relative strength index (RSI) signifies the bearish price action for Ripple, as it moved into a severe oversold region at 22.79. Coupled with a 27 percent increase in XRP trading volume, a bearish market valuation is confirmed. Meanwhile, the moving average convergence divergence (MACD) curve continues to form lower lows below the neutral zone, providing significant evidence that price is set to continue along the current downtrend. On the upper side, if buyers are able to rescue price before hitting the next support zone at $0.25, the upper resistance levels sit at $0.70 and $0.75.
Disclaimer. The information provided is not trading advice. Cryptopolitan.com holds no liability for any investments made based on the information provided on this page. We strongly recommend independent research and/or consultation with a qualified professional before making any investment decisions.
- 000
- 100
- 2022
- 28
- 7
- 70
- 9
- across
- Action
- advice
- Altcoins
- among
- analysis
- average
- bearish
- Bears
- below
- board
- buyers
- continue
- continues
- could
- coupled
- Crash
- crucial
- cryptocurrencies
- cryptocurrency
- cryptocurrency market
- Current
- curve
- decisions
- down
- Drop
- dropped
- EMA
- expected
- form
- Free
- further
- holds
- However
- HTTPS
- immediate
- Increase
- index
- information
- investment
- Investments
- IT
- larger
- lead
- Level
- liability
- made
- major
- Making
- map
- Market
- Monday
- more
- move
- movement
- moving
- Other
- Outlook
- overall
- Pattern
- percent
- Polkadot
- present
- price
- Price Analysis
- professional
- provides
- providing
- qualified
- quickly
- recommend
- research
- Ripple
- Ripple Price Analysis
- sentiment
- set
- significant
- signifies
- Signs
- similar
- since
- Solana
- strength
- support
- support level
- Target
- towards
- trade
- Trading
- Valuation
- volume
- would
- xrp
- XRP Price


