Published 7 hours ago
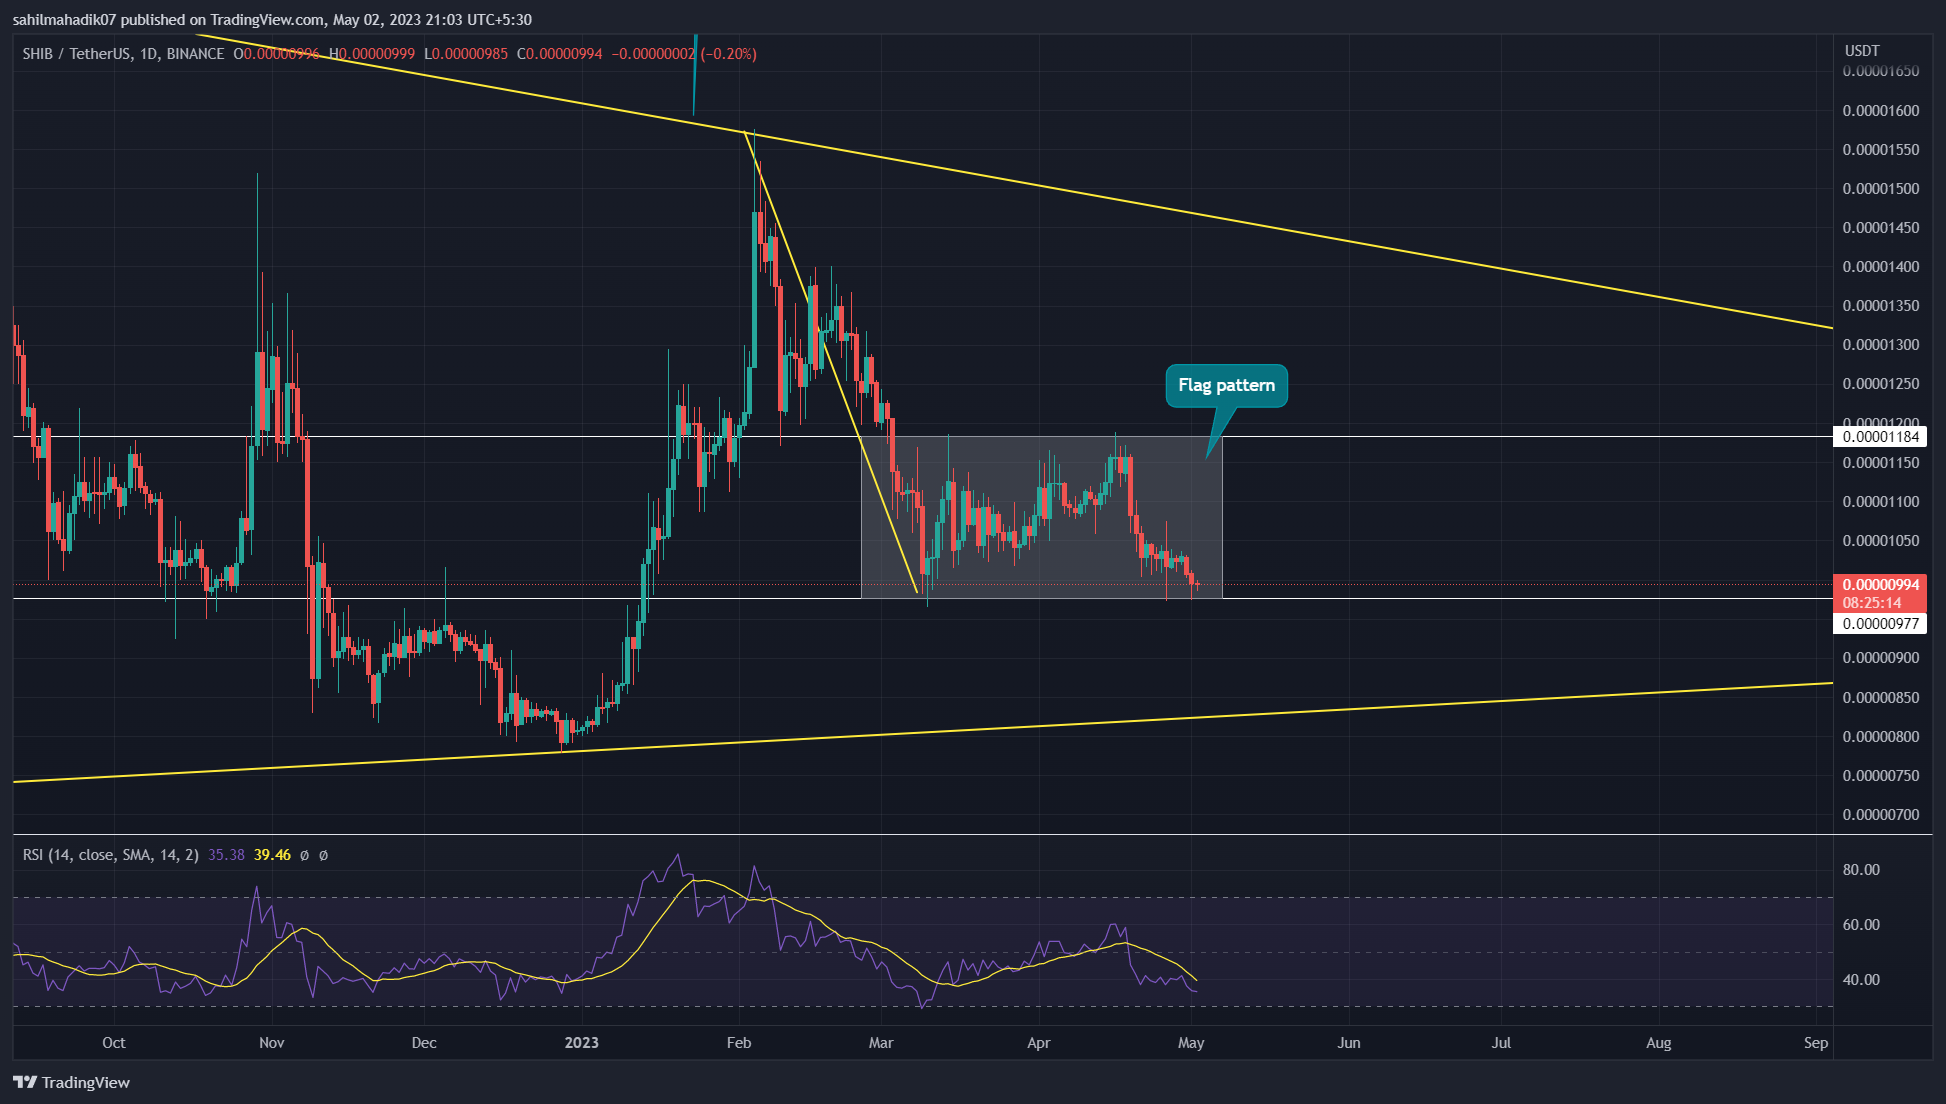
SHIB Price Prediction: The ongoing correction phase in the Shiba Inu price takes a tiny detour after hitting $0.00000981 support. The strong support has turned the falling prices sideways and revealed the formation of a famous bearish continue pattern called an inverted flag. In theory, the pattern prolongs the ongoing downtrend after the prices breach the flag support and offers a short-selling opportunity to interested traders.
advertisement
Key Points:
- A bearish breakdown from the $0.00000981 support will accelerate selling pressure and tumble the coin price 12% down
- A long-coming support trendline may undermine the ongoing correction phase
- The intraday trading volume of the Shiba Inu coin is $110.4 Million, showing a 13% loss.

 Source- Tradingview
As shown in the above chart, the SHIB price is resonating within the flag range spread from $0.0000118 and $0.00000977. As of now, the coin price trades at the $0.00000995 mark and retests the aforementioned support.
Under the influence of this pattern, the coin price is likely to escape this temporary sideways trend once sellers pierce the $0.00000977 local support. This breakdown may intensify the selling pressure and tumble of 12% down to retest an ascending trendline.
Trending Stories
Triangle Pattern Likely To Replenish Bullish Momentum In Shiba Inu Price

 Source- Tradingview
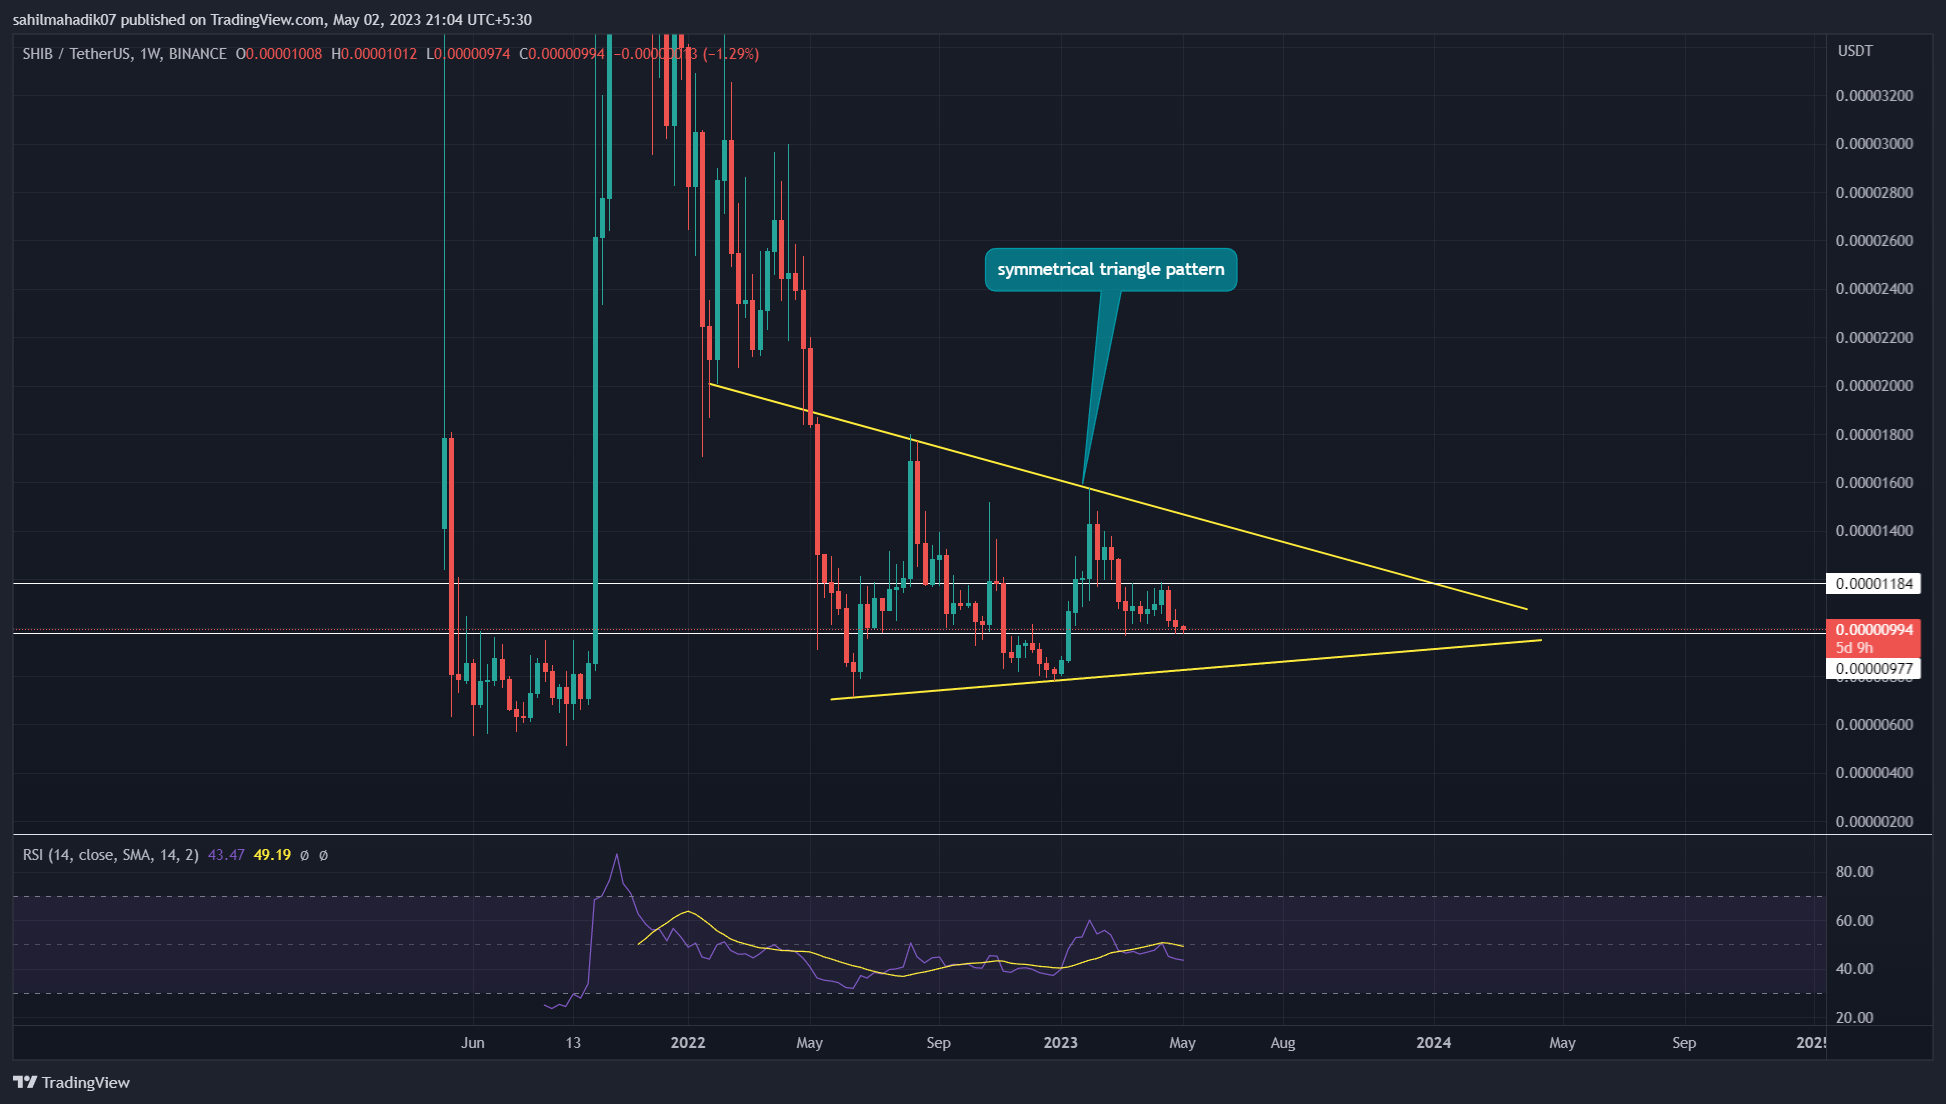
In the weekly time frame chart, the aforementioned ascending trendline is part of a bigger chart pattern called a symmetrical triangle. This chart pattern has maintained a sideways trend in Shiba Inu price for nearly a year.
Thus, this long-coming chart pattern should have a stronger impact on Shiba Inu’s future trend, and therefore a retest to this support trendline is more likely to trigger a fresh recovery rally like it did in June 2022, and January 2023.
Technical indicator
Moving Average Convergence Divergence: The weekly MACD(blue) and signal(orange) lines give a strong sell signal with its bearish crossover below the midline.
Exponential Moving Average: The 20-day EMA act as a dynamics resistance to assist selling to complete the bearish pattern
Shiba Inu Price Intraday Levels
- Spot price: $0.0000995
- Trend: Bearish
- Volatility: High
- Resistance levels- $0.0000107 and $0.0000117
- Support levels: $0.00001 and $0.00000875
Share this article on:
advertisement
The presented content may include the personal opinion of the author and is subject to market condition. Do your market research before investing in cryptocurrencies. The author or the publication does not hold any responsibility for your personal financial loss.
<!– Close Story–>
- SEO Powered Content & PR Distribution. Get Amplified Today.
- PlatoAiStream. Web3 Data Intelligence. Knowledge Amplified. Access Here.
- Minting the Future w Adryenn Ashley. Access Here.
- Source: https://coingape.com/markets/shib-price-prediction-bearish-pattern-threatens-shiba-inu-price-for-12-fall/
- :has
- :is
- :not
- 1
- 10
- 12
- 14
- 1inch
- 20
- 2022
- 2023
- 7
- 8
- 9
- a
- above
- accelerate
- Act
- Ad
- After
- ago
- am
- an
- and
- any
- article
- AS
- assist
- At
- author
- avatar
- average
- banner
- bearish
- Beauty
- before
- below
- bigger
- binance
- blockchain
- Blue
- breach
- Breakdown
- Breaking
- Brian
- Bullish
- but
- called
- Catch
- Chart
- Coin
- Coingape
- COM
- complete
- condition
- content
- continue
- Convergence
- correction phase
- cryptocurrencies
- cryptocurrency
- DID
- different
- Divergence
- do
- does
- down
- downtrend
- dynamics
- Entertainment
- escape
- Fall
- Falling
- famous
- Fashion
- finance
- financial
- follow
- For
- formation
- FRAME
- fresh
- from
- future
- FXS
- Give
- Have
- hitting
- hold
- HOURS
- HTTPS
- i
- Impact
- in
- include
- Including
- influence
- Innovation
- interested
- Inu
- investing
- IT
- ITS
- January
- journalism
- june
- Last
- levels
- like
- likely
- lines
- local
- loss
- mark
- Market
- market research
- May..
- million
- Momentum
- more
- moving
- moving average
- nearly
- now
- of
- Offers
- on
- once
- ongoing
- Opinion
- Opportunity
- or
- Orange
- out
- part
- past
- Pattern
- personal
- phase
- plato
- Plato Data Intelligence
- PlatoData
- plugin
- points
- prediction
- presented
- pressure
- price
- Price Prediction
- Prices
- Publication
- rally
- range
- reach
- recovery
- research
- Resistance
- responsibility
- Revealed
- sell
- Sellers
- Selling
- Share
- SHIB
- SHIB Price
- Shiba
- Shiba Inu
- Shiba Inu Coin
- Shiba Inu Price
- Short-selling
- should
- shown
- sideways
- Signal
- spread
- strong
- stronger
- subject
- support
- takes
- temporary
- The
- The Weekly
- therefore
- this
- threatens
- time
- to
- Topics
- Traders
- trades
- Trading
- trading volume
- TradingView
- Trend
- trending
- trigger
- tumble
- Turned
- TWT
- Undermine
- variety
- volume
- weekly
- will
- with
- within
- working
- written
- year
- years
- Your
- zephyrnet


