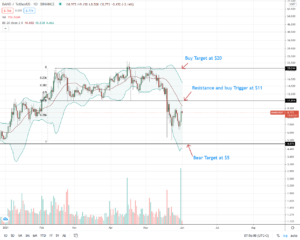
Seller-driven market undermines the falling channel in the SHIB coin price chart. Will the downtrend reach the $0.000015 mark? SHIBA INU’s website invites dog-inspired artists from around the world to promote an “artistic Shiba movement” as they expand the SHIBA INU community into the NFT market. It has also created an initiative using Amazon Smile in order to solicit donations to help rescue live Shiba Inu dogs by partnering with The Shiba Inu Rescue Association. Bitstamp is the largest crypto exchange in Europe has announced that it will offer Shiba Inu to trade in 2022, at the start of the year. Korbit is one of the South Korean exchanges, becoming the first exchange in the country to offer the SHIB token in 2021. Let us move ahead to read about Shiba Inu’s technical analysis. Past Performance of SHIB SHIB coin price succumbs under the selling pressure during the retest of the rising channel breakout, mentioned in our previous article. The coin price decreased by 25% in the past 24 hours, resulting in the creation of a bearish engulfing candlestick. Moreover, the price dives back within the falling channel. SHIB/USD Daily Chart SHIB Technical Analysis The SHIB coin price fails to rise after touching the resistance trendline of the falling channel to retest the bullish breakout. As the price re-enters the falling channel and breaks below the $0.000020 mark, a downfall to $0.000015 is possible. The declining Crucial Exponential Moving Averages on the daily chart provide a bearish crossover between the 50-day and 100-day averages. Additionally, the SHIB coin price trends are lower than the 200-day EMA. The MACD indicator shows the MACD and signal lines diverging, giving a bearish crossover after the recent merger. Moreover, the restart of the falling histogram in the daily chart. The Ultimate Oscillator indicator at 27 reflects a rise in underlying selling pressure as the slope enters the oversold zone. Therefore, the indicator hints at a bearish continuation to $0.000015. In conclusion, the technical indicators showcase a plausible continuation to $0.000015 with the increased trend momentum. Upcoming Trend With the failure of the bullish breakout retest of the falling channel, the SHIB coin price falls under the $0.000020 mark. Moreover, the bearish crossover of the 50 and 100-day EMA increases the bearish attention for the coin price. The price action shows the support levels present at $0.000015 and $0.000012 present within the falling channel. In case the price gives lower price rejection to rise higher, the resistance level at $0.000020 and $0.000025. At press time, the technical analysis by TradingView gives “STRONG SELL” for the SHIB token. Technical Analysis for SHIBUSD by TradingView
The post SHIB Technical Analysis: Sellers Drive the Price Below $0.000020 appeared first on Cryptoknowmics-Crypto News and Media Platform.
- "
- 2022
- About
- Action
- Amazon
- analysis
- announced
- around
- article
- Artists
- Association
- bearish
- Bitstamp
- breakout
- Bullish
- Coin
- community
- crypto
- crypto exchange
- Display
- donations
- EMA
- Enters
- Europe
- exchange
- Exchanges
- Expand
- Failure
- First
- Giving
- help
- HTTPS
- increased
- Initiative
- IT
- Korean
- Level
- mark
- Market
- Media
- Momentum
- move
- news
- NFT
- offer
- order
- performance
- present
- press
- pressure
- price
- promote
- provide
- Sellers
- South
- start
- support
- Technical
- Technical Analysis
- the world
- time
- token
- trade
- Trends
- us
- Website
- within
- world
- year


