SNEAK PEAK
- Solana price analysis shows an uptrend at $19.46 after a bullish run.
- SOL/USD has increased by around 2.00 percent in the past few hours.
- The Altcoin is facing a strong rejection at the $19.70 level.
According to the latest Solana price analysis, the digital asset is experiencing a bullish trend and is currently being traded at $19.46. Over the past few hours, the cryptocurrency has gained 2.00 percent and is in high demand among buyers. The SOL/USD pair is currently trading above the support level of $18.89 and is expected to rise further as it continues to trend upward.
The previous day the SOL market faced a minor pullback at $18.89, which is now acting as a strong support level. However, today the bullish momentum is strong, and the token looks to be pushing higher. The bulls are trying to break past the $19.70 resistance level but are facing a strong rejection as buyers try to take control of the market. The selling pressure has weakened, and if the bulls can break past this level, then SOL/USD is expected to rally higher.
The trading volume for the token is also increasing, indicating more people are getting involved in the market. Currently, the trading volume is $383 million, up by 5.20 percent when compared to the previous day. The market capitalization for the token is $7.79 billion and ranks 10th in terms of market cap. The circulating supply of the token is 400,893,571 SOL.
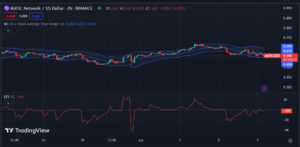
The technical indicators for the digital asset are also looking bullish, with the 20-EMA line crossing above the 50-EMA line. The MACD indicator is also pointing towards a bullish signal. The signal line and the MACD line are both trending above the zero line, indicating more buying pressure is likely to come. Additionally, the MACD line is above the signal line at 0.53, indicating that the bulls have more control over the market.
The Relative Strength Index (RSI) is at 64.80, which means that the asset is in neither overbought nor oversold territory, and if bulls persist, the RSI could go enter the overbought zone. On the other hand, if selling pressure intensifies, then the RSI could go back into the oversold zone. The Average directional index (ADX) is at 19.01, which shows that the SOL market is still in a bullish rally. Additionally, the +D1 line is trending above the –D1 line, which is indicative of a bullish crossover.
Overall, the Solana price analysis shows that bulls are currently in control of the market, and further bullish momentum is expected to take place as buyers continue to pile in. The buying pressure is high, and the token is expected to break past the $19.70 resistance level as buyers look to accumulate more SOL tokens. The technical indicators are all pointing towards a bullish signal, and if bulls persist, then SOL/USD could rally higher in the upcoming days.
Disclaimer: Cryptocurrency price is highly speculative and volatile and should not be considered financial advice. Past and current performance is not indicative of future results. Always research and consult with a financial advisor before making investment decisions.
- SEO Powered Content & PR Distribution. Get Amplified Today.
- PlatoData.Network Vertical Generative Ai. Empower Yourself. Access Here.
- PlatoAiStream. Web3 Intelligence. Knowledge Amplified. Access Here.
- PlatoESG. Automotive / EVs, Carbon, CleanTech, Energy, Environment, Solar, Waste Management. Access Here.
- BlockOffsets. Modernizing Environmental Offset Ownership. Access Here.
- Source: https://investorbites.com/solana-sol-price-analysis-03-07/
- :has
- :is
- :not
- $UP
- 10th
- 12
- 13
- 19
- 20
- 22
- 70
- 80
- a
- above
- Accumulate
- acting
- Additionally
- advice
- advisor
- adx
- After
- All
- also
- Altcoin
- Altcoin News
- always
- among
- an
- analysis
- and
- ARE
- around
- AS
- asset
- At
- average
- average directional index
- back
- BE
- before
- being
- Billion
- blockchain
- both
- Break
- Bullish
- Bulls
- but
- buyers
- Buying
- by
- CAN
- cap
- capitalization
- circulating
- come
- compared
- considered
- continue
- continues
- control
- could
- cryptocurrency
- Cryptocurrency Price
- Current
- Currently
- day
- Days
- decisions
- Demand
- digital
- Digital Asset
- Enter
- EVER
- expected
- experiencing
- faced
- facing
- few
- financial
- financial advice
- First
- For
- further
- future
- gained
- getting
- Go
- hand
- Have
- High
- higher
- highly
- HOURS
- However
- HTTPS
- if
- in
- increased
- increasing
- index
- Indicator
- Indicators
- Intensifies
- internal
- into
- investment
- investor
- involved
- IT
- latest
- Level
- likely
- Line
- Look
- looking
- LOOKS
- MACD
- Making
- Market
- Market Cap
- Market Capitalization
- Market News
- means
- million
- minor
- Momentum
- more
- Neither
- news
- now
- of
- on
- Other
- over
- pair
- past
- People
- percent
- performance
- Place
- plato
- Plato Data Intelligence
- PlatoData
- pressure
- previous
- price
- Price Analysis
- pullback
- Pushing
- rally
- ranks
- relative
- relative strength index
- research
- Resistance
- Results
- Rise
- rsi
- Run
- Selling
- should
- Shows
- Signal
- SOL
- SOL/USD
- Solana
- Solana News
- Solana Price
- solana price analysis
- speculative
- Still
- strength
- strong
- supply
- support
- support level
- Take
- Technical
- terms
- territory
- that
- The
- then
- this
- to
- today
- token
- Tokens
- towards
- traded
- Trading
- trading volume
- Trend
- trending
- try
- upcoming
- uptrend
- upward
- volatile
- volume
- What
- What is
- when
- which
- with
- zephyrnet
- zero


