This is a follow-up analysis of our prior report, “US stock market bulls are facing a reality check (3 ominous signs to watch)” published on 14 February 2024. Click here for a recap.
In the past two weeks, the US SPX 500 has continued its pace of acceleration and hit another fresh all-time of 5,150 on Monday, 4 March.
However, under the surface, there are signs of weakness from a sector rotation perspective. The SPX 500 is broken down into 11 key sectors and relative performance among the sectors such as “aggressive” over “defensive” tends to form a leading indication towards the movement of the S&P 500 based on past price actions.
Potential underperformance of Consumer Discretionary over Consumer Staples
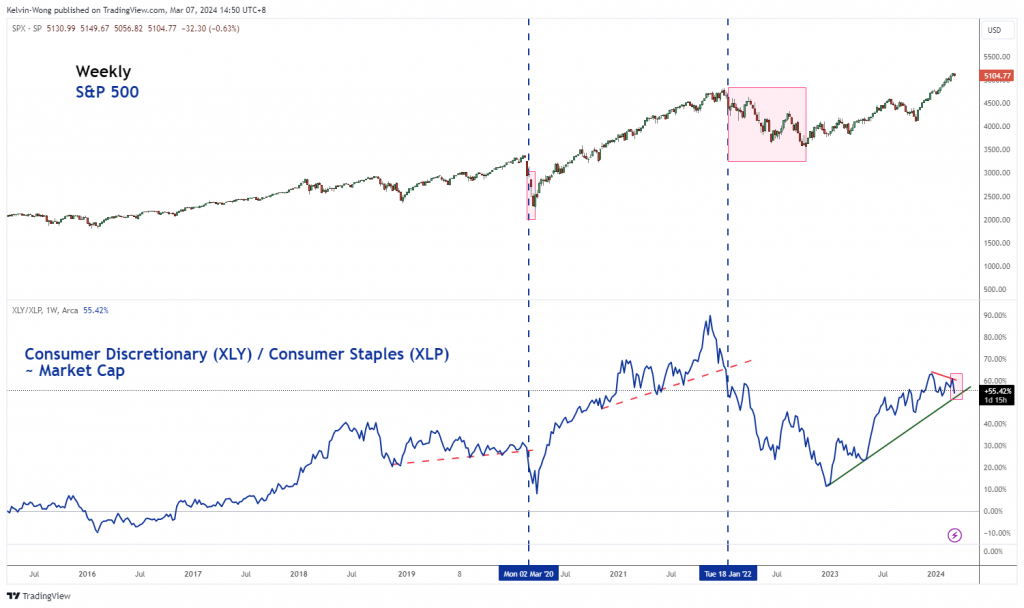
Fig 1: S&P Consumer Discretionary/Consumer Staples ratio major trend as of 7 Mar 2024 (Source: TradingView, click to enlarge chart)
The Consumer Discretionary sector is considered as a high beta “aggressive” sector as its performance in general moves directly with the cyclical trend of the economy. In contrast, the Consumer Staples sector is a lower beta sector that is being labeled as “defensive” because its movement is less synchronized directly with a typical economic cycle.
By plotting the ratio of the Consumer Discretionary sector exchange-traded fund (XLY) over the Consumer Staples sector exchange-traded fund (XLP), we can have a visual quantitative relative performance historical chart.
Next, overlayed the weekly ratio chart of XLY/XLP with the SPX 500 (see Fig 1), we can detect two recent underperformances of the XLY over XLP (the ratio broke below its support) that led to a multi-week corrective decline inflicted on the SPX 500.
On the week of 2 March 2020, the XLY/XLP ratio broke below its key support, and thereafter the S&P 500 shed -22%. The next occasion was on the week of 18 January 2022 where the XLY/XLP broke down below its support followed by a -18% decline in the SPX 500 over the next nine months.
Right now, the current price actions of the XLY/XLP ratio have inched lower in the past two weeks and are about to seek a retest on its key support in place since the week of 19 December 2022. Also, before the current retest of its support, it has shaped a lower high which increases the risk of a looming underperformance of Consumer Discretionary over Consumer Staples that in turn may trigger a potential multi-week corrective decline on the SPX 500.
Watch the key resistance of 5,150 on the SPX 500
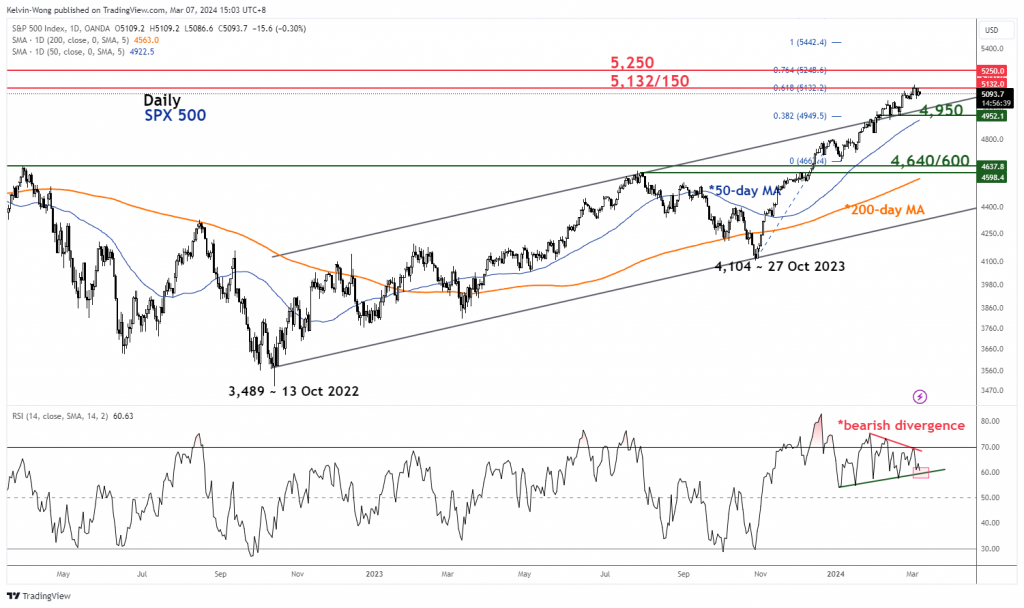
Fig 2: US SPX 500 medium-term & major trends as of 7 Mar 2024 (Source: TradingView, click to enlarge chart)
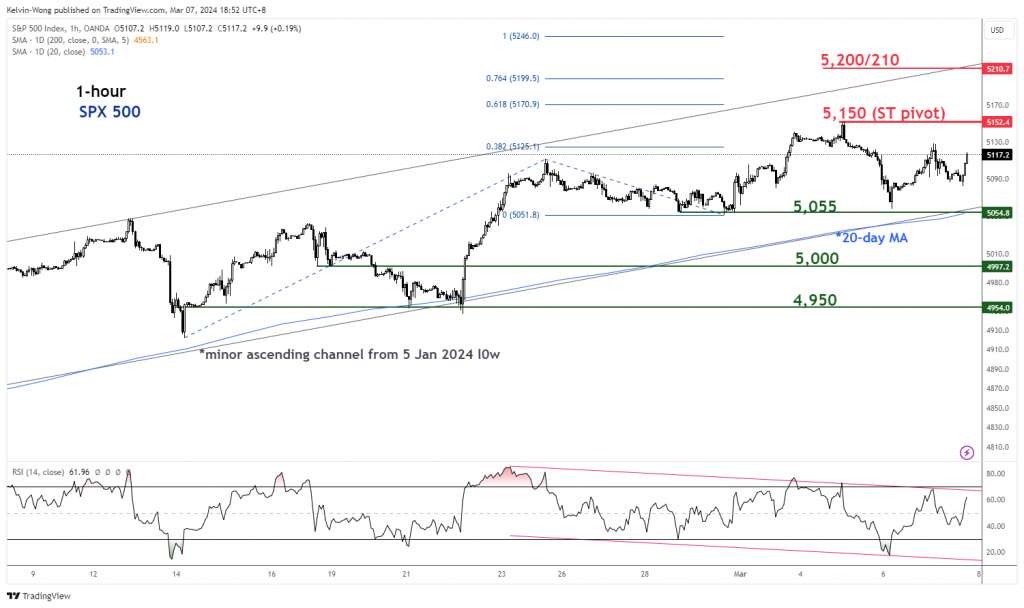
Fig 3: US SPX 500 short-term trend as of 7 Mar 2024 (Source: TradingView, click to enlarge chart)
The daily RSI momentum indicator of the SPX 500 has flashed out a persistent bearish divergence condition at its overbought region since 9 February 2024 which indicates a slowdown in medium-term upside momentum.
If the 5,150 key pivotal resistance on the SPX 500 is not surpassed to the upside, and a break below the 5,055 near-term support (also the 20-day moving average) may trigger the start of a multi-week corrective decline that exposes the next intermediate supports at 5,000 and 4,950 in the first step.
On the flip side, a clearance above 5,150 invalidates the bearish scenario for the continuation of the impulsive upmove sequence for the next intermediate resistance to come in at 5,200/210.
Content is for general information purposes only. It is not investment advice or a solution to buy or sell securities. Opinions are the authors; not necessarily that of OANDA Business Information & Services, Inc. or any of its affiliates, subsidiaries, officers or directors. If you would like to reproduce or redistribute any of the content found on MarketPulse, an award winning forex, commodities and global indices analysis and news site service produced by OANDA Business Information & Services, Inc., please access the RSS feed or contact us at info@marketpulse.com. Visit https://www.marketpulse.com/ to find out more about the beat of the global markets. © 2023 OANDA Business Information & Services Inc.
- SEO Powered Content & PR Distribution. Get Amplified Today.
- PlatoData.Network Vertical Generative Ai. Empower Yourself. Access Here.
- PlatoAiStream. Web3 Intelligence. Knowledge Amplified. Access Here.
- PlatoESG. Carbon, CleanTech, Energy, Environment, Solar, Waste Management. Access Here.
- PlatoHealth. Biotech and Clinical Trials Intelligence. Access Here.
- Source: https://www.marketpulse.com/indices/spx-500-technical-the-bulls-are-getting-tired/kwong
- :has
- :is
- :not
- :where
- ][p
- 000
- 1
- 11
- 14
- 15 years
- 15%
- 150
- 19
- 2020
- 2022
- 2023
- 2024
- 500
- 7
- 700
- 9
- a
- About
- above
- acceleration
- access
- actions
- addition
- advice
- affiliates
- also
- among
- an
- Analyses
- analysis
- and
- Another
- any
- ARE
- around
- AS
- At
- author
- authors
- avatar
- average
- award
- based
- bearish
- bearish divergence
- beat
- because
- before
- being
- below
- beta
- Box
- Break
- Broke
- Broken
- Bulls
- business
- buy
- by
- CAN
- Chart
- check
- clearance
- click
- COM
- combination
- come
- Commodities
- condition
- conducted
- Connecting
- considered
- consumer
- contact
- content
- continuation
- continued
- contrast
- courses
- Current
- cycle
- Cyclical
- daily
- December
- Decline
- detect
- directly
- Directors
- discretionary
- Divergence
- down
- Economic
- economy
- Elliott
- enlarge
- exchange
- exchange-traded
- experience
- expert
- facing
- February
- fig
- financial
- Find
- First
- Flip
- flow
- followed
- For
- foreign
- foreign exchange
- forex
- form
- found
- fresh
- from
- fund
- fundamental
- General
- getting
- Global
- global markets
- Have
- High
- historical
- Hit
- HTTPS
- if
- impulsive
- in
- Inc.
- Increases
- indicates
- indication
- Indicator
- Indices
- information
- into
- investment
- IT
- ITS
- January
- Kelvin
- Key
- key resistance
- Last
- leading
- Led
- less
- levels
- like
- looming
- lower
- Macro
- major
- mar
- March
- march 2020
- Market
- market outlook
- market research
- MarketPulse
- Markets
- max-width
- May..
- Momentum
- Monday
- months
- more
- movement
- moves
- moving
- moving average
- necessarily
- news
- next
- nine
- now
- numerous
- occasion
- of
- officers
- on
- only
- Opinions
- or
- our
- out
- Outlook
- over
- Pace
- passionate
- past
- performance
- perspective
- perspectives
- photo
- pivotal
- Place
- plato
- Plato Data Intelligence
- PlatoData
- please
- positioning
- Posts
- potential
- price
- Prior
- Produced
- providing
- published
- purposes
- quantitative
- ratio
- Reality
- recap
- recent
- region
- relative
- research
- Resistance
- retail
- Reversal
- Risk
- rsi
- rss
- S&P
- S&P 500
- scenario
- sector
- Sectors
- Securities
- see
- Seek
- sell
- senior
- Sequence
- service
- Services
- shaped
- sharing
- shed
- short-term
- side
- Signs
- since
- Singapore
- site
- Slowdown
- solution
- Source
- specializing
- spx
- start
- Step
- stock
- stock market
- Stock markets
- Strategist
- such
- support
- Supports
- Surface
- surpassed
- Technical
- Technical Analysis
- ten
- tends
- that
- The
- The Weekly
- There.
- thousands
- tired
- to
- towards
- Traders
- Trading
- TradingView
- Training
- Trend
- Trends
- trigger
- TURN
- two
- typical
- under
- unique
- Upside
- us
- using
- v1
- Visit
- visual
- was
- Watch
- Wave
- we
- weakness
- week
- weekly
- Weeks
- WELL
- which
- winning
- with
- wong
- would
- years
- You
- zephyrnet


