Bitcoin (BTC) has bounced at the $43,900 horizontal support area.
Ethereum (ETH) and XRP (XRP) are trading above horizontal support levels.
Enjin Coin (ENJ) is trading inside an ascending parallel channel.
IOTA (IOTA) and Chiliz (CHZ) have completed fourth wave pullbacks.
Ankr (ANKR) has broken out from a descending parallel channel.
BTC
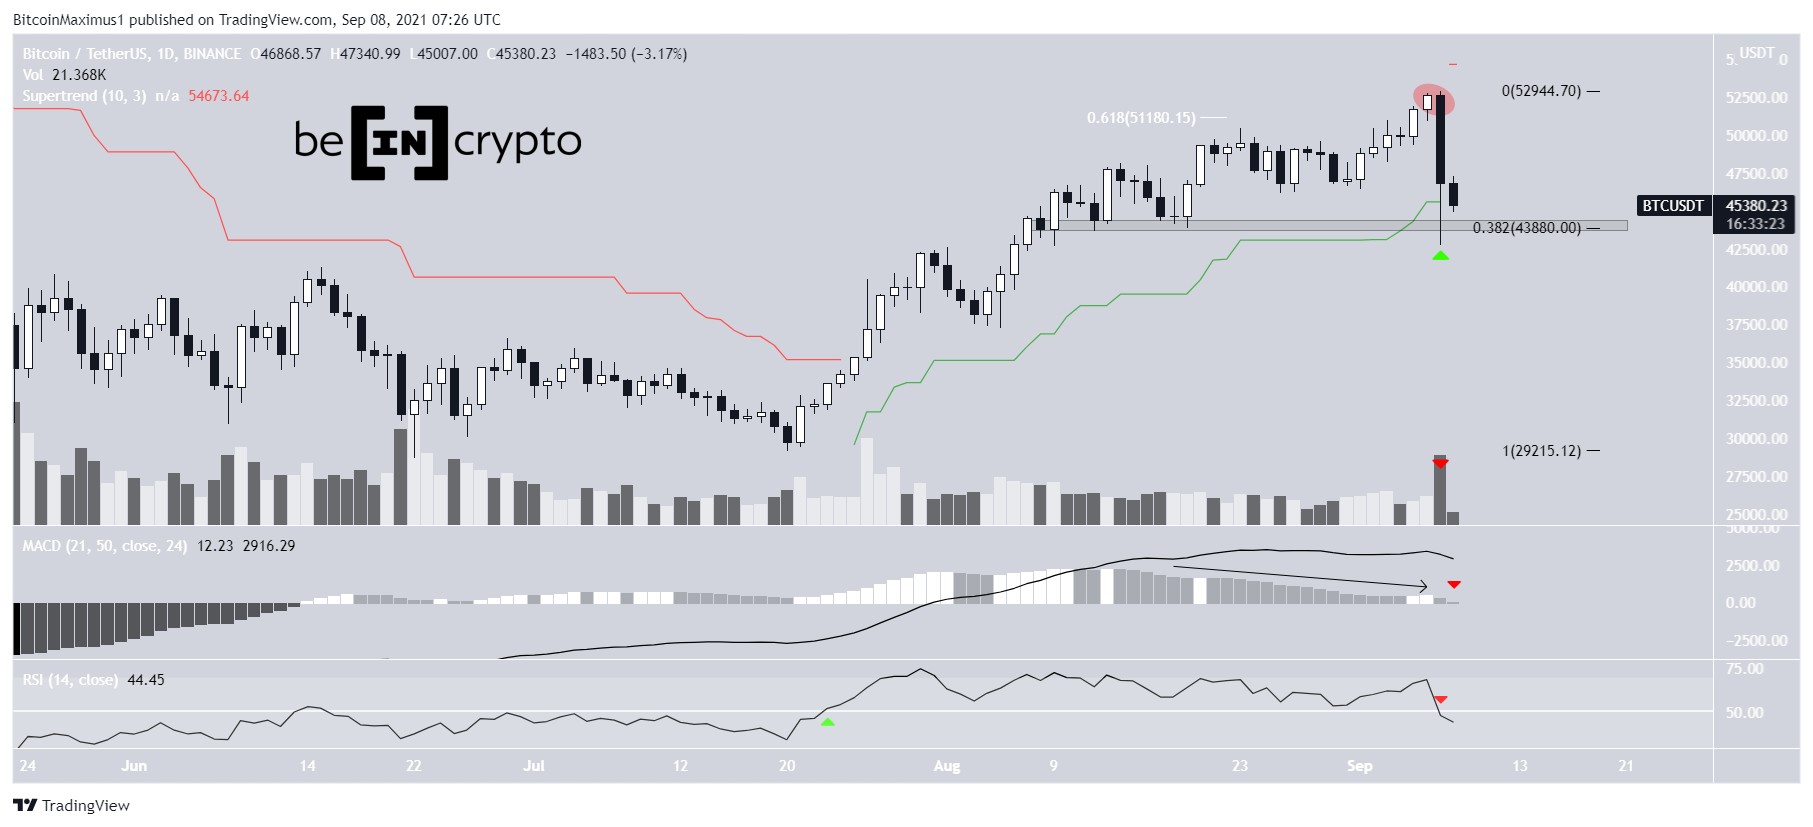
On Sept 7, BTC reached a high of $52,620. However, it fell sharply the same day, reaching a low of $42,483.
After the drop, BTC bounced considerably, creating a very long lower wick (green icon). The bounce validated the $43,900 area as support. Besides being a horizontal support area, it is also the 0.382 Fib retracement support level.
Even though BTC has bounced, technical indicators in the daily time-frame have turning bearish. The most bearish sign is the RSI cross below 50 (red icon), since the movement of the indicator above 50 (green icon) was the catalyst for the beginning of the upward movement.
In addition to this, the MACD has almost turned negative.
ETH
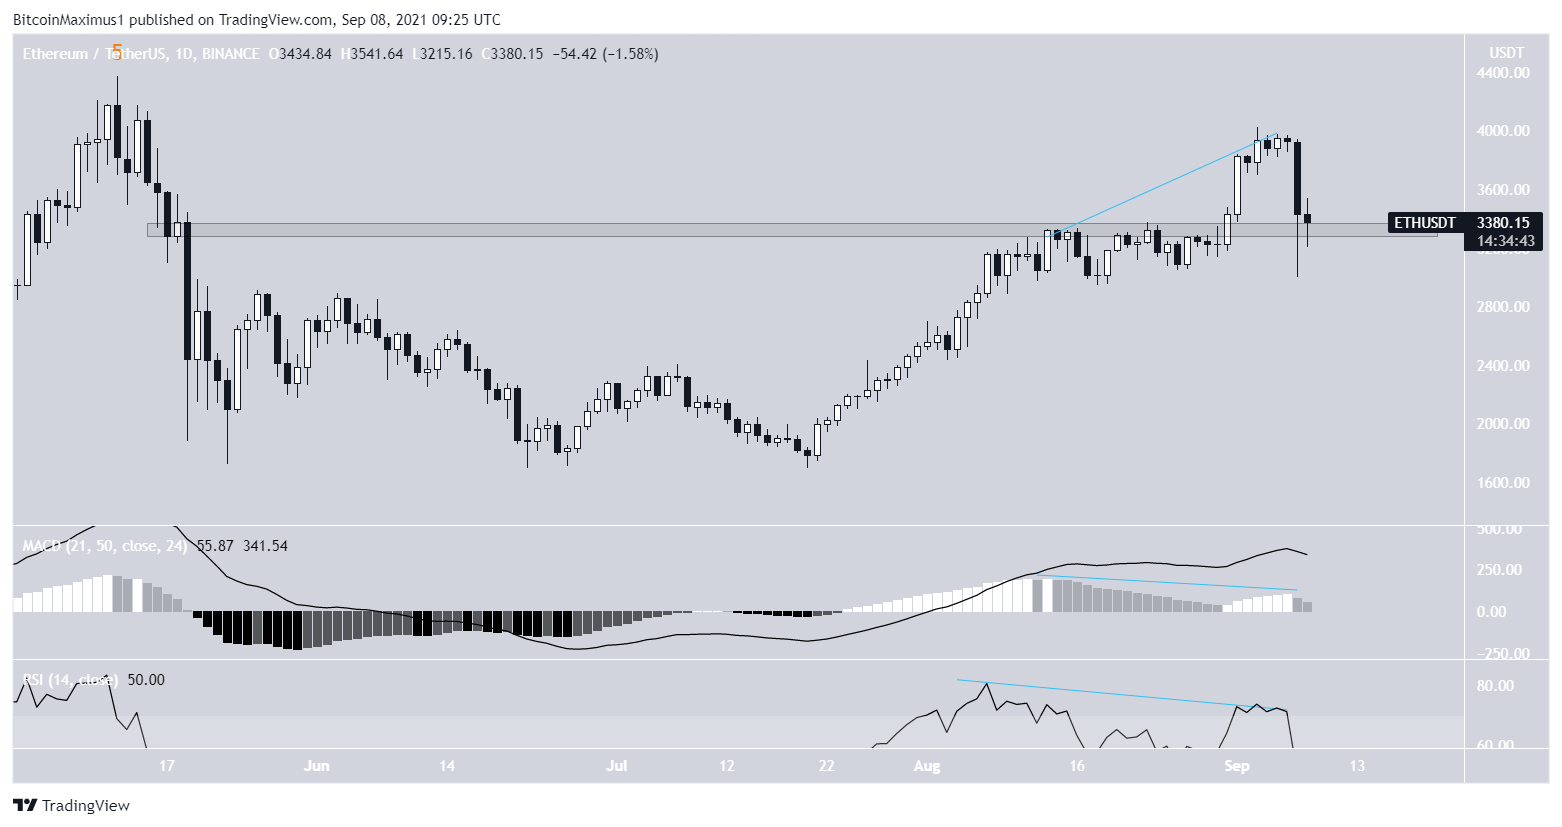
ETH has been increasing since July 20. In the beginning of August, it struggled to move above the $3,330 resistance area. However, it was finally successful in breaking out on Aug. 31. This led to a high of $4,027 on Sept. 3.
However, ETH has been decreasing since, accelerating its rate of decrease on Sept. 7. The drop was preceded by considerable bearish divergence in both the RSI and MACD. While the token reached a low of $3,005, it bounced the same day and created a long lower wick. This validated the $3,330 area as support.
Despite the fact that ETH is trading above support, it is likely that it has reached a local top.
XRP
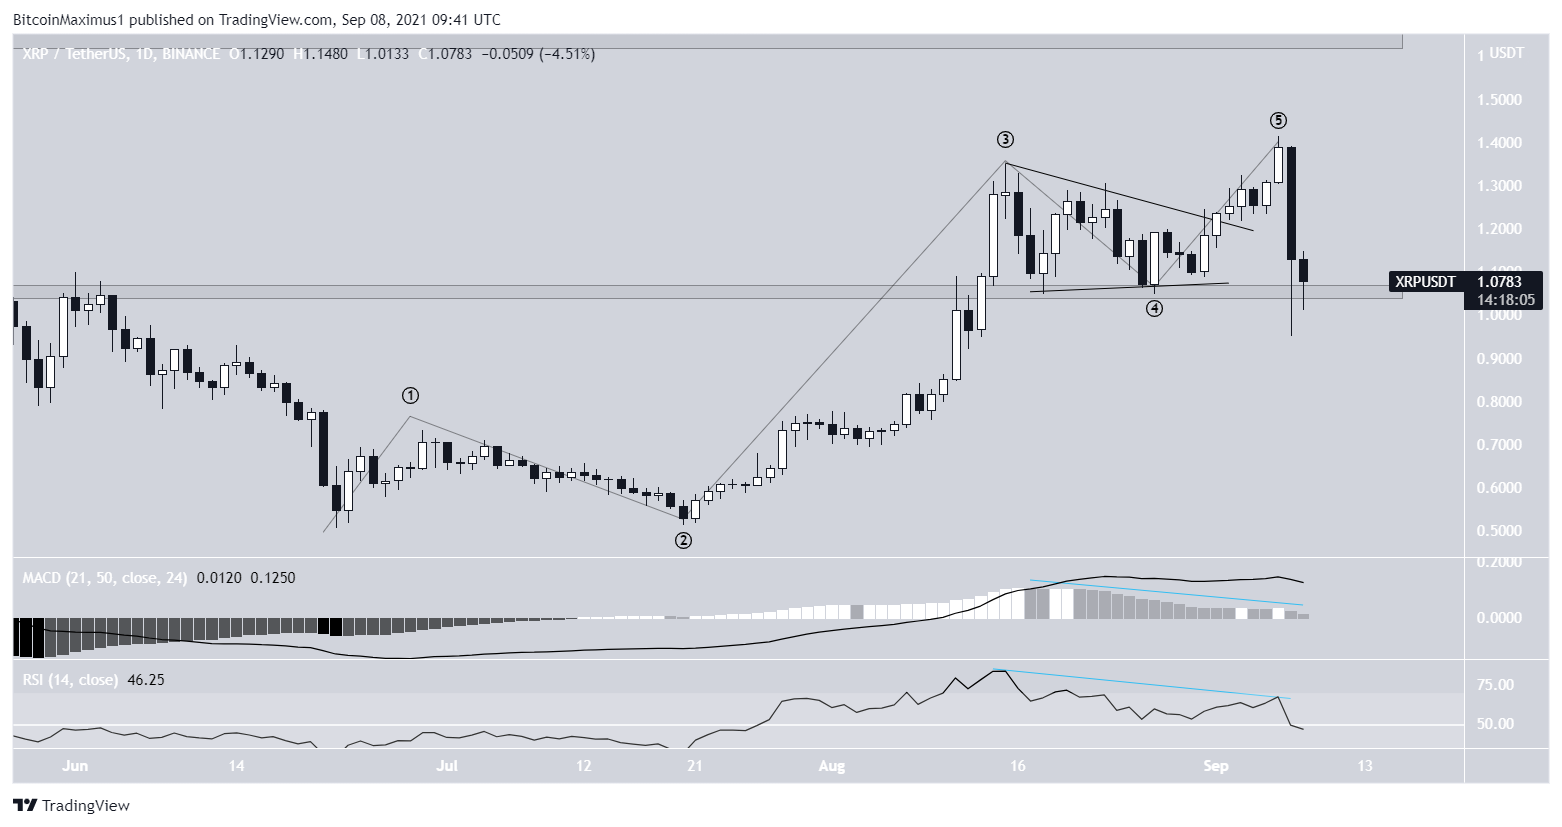
XRP has been increasing since June 22. It created a higher low on July 20 and accelerated its rate of increase afterwards.
On Aug. 13, it broke out from the $1.05 horizontal resistance area and validated it as support on Aug. 19.
XRP proceeded to reach a high of $1.41 on Sept. 6 before falling. The drop was preceded by bearish divergence in both the MACD and RSI.
While XRP is still trading above the $1.05 horizontal support area, it is likely that the upward movement has ended.
ENJ
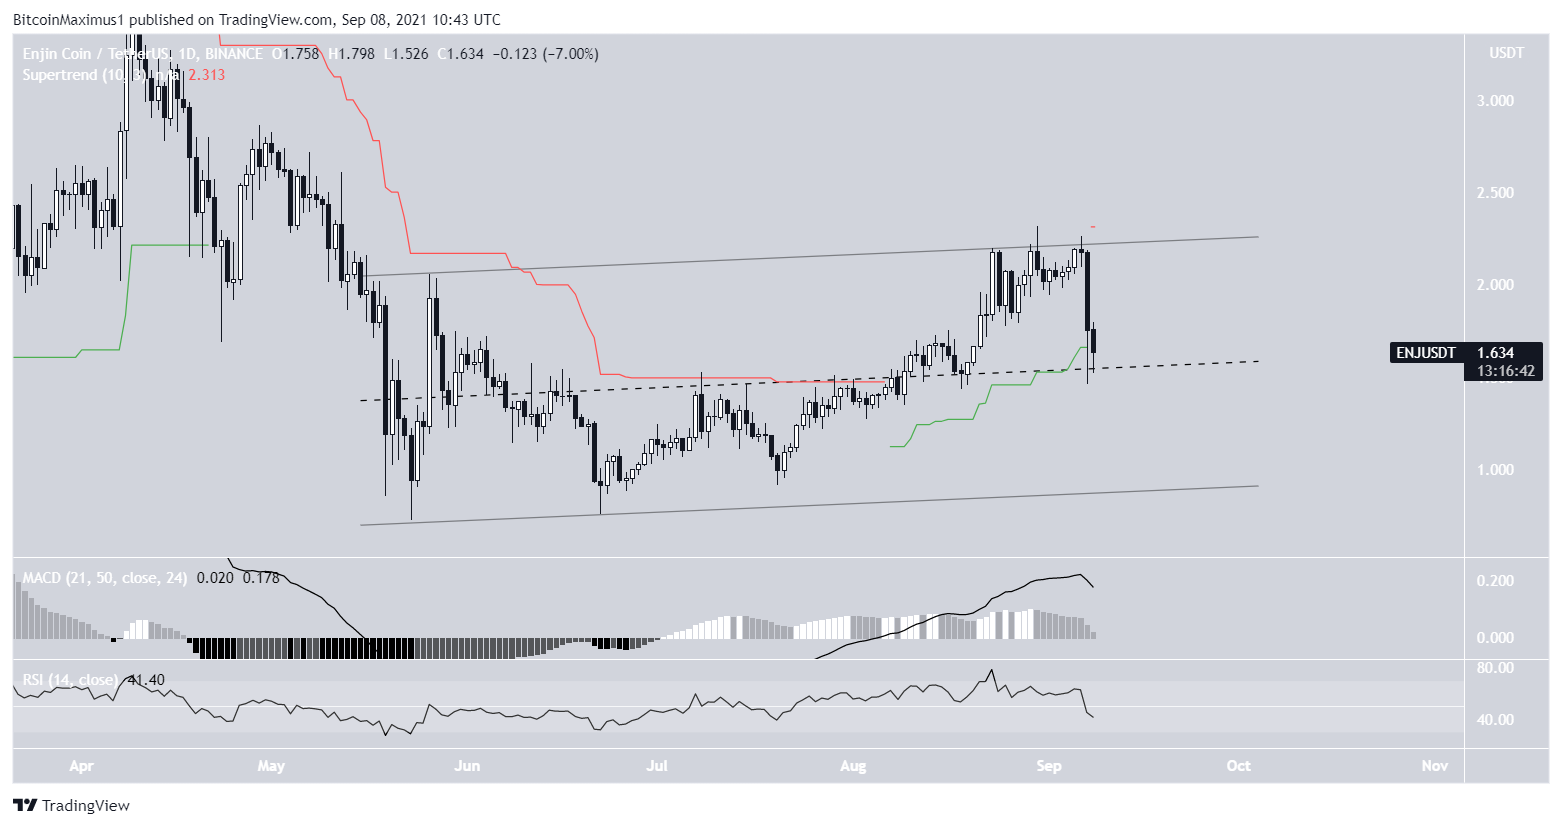
ENJ has been increasing inside an ascending parallel channel since May 23. On Aug. 30, it reached the resistance line of the channel and was rejected. It started to fall sharply on Sept. 7.
However, it bounced at the middle of the channel and the Supertrend line (green). As long as it is trading in the upper portion of the channel, the possibility that it will break out remains valid.
Nevertheless, technical indicators are turning bearish, reducing the possibility of a potential breakout.
IOTA
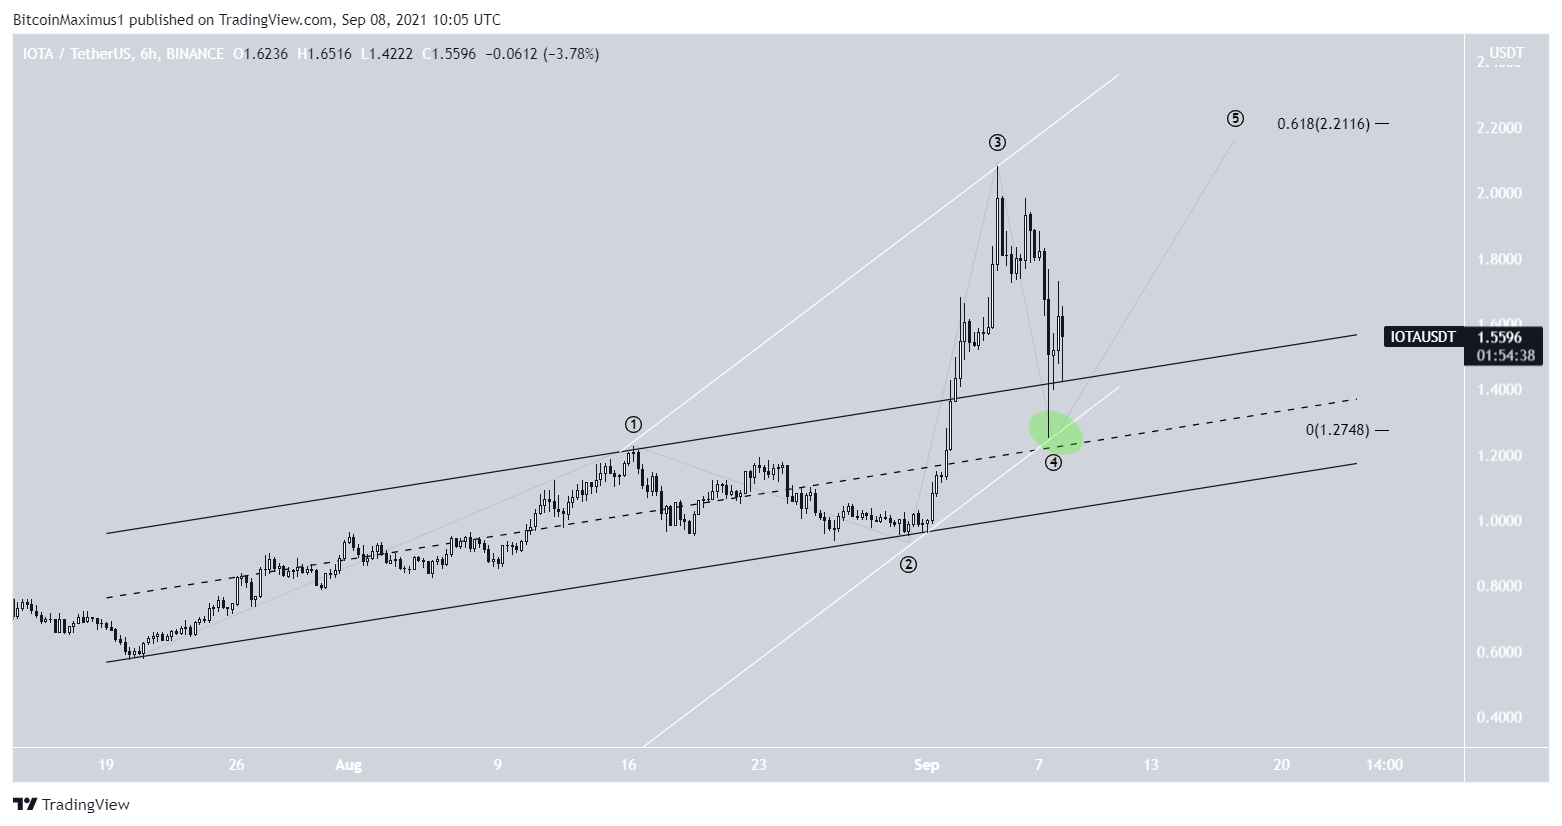
IOTA has been moving upwards since July 20. It broke out from an ascending parallel channel on Sept. 2 and reached a high of $2.08 two days later.
On Sept. 8, IOTA fell to a low of $1.25, successfully completing a fourth wave pullback. The low was also made right at the support line of the 1-3 channel (white).
A potential target for the top of wave five would be near $2.11. The target is found using the 0.618 length of waves 1-3.
ANKR
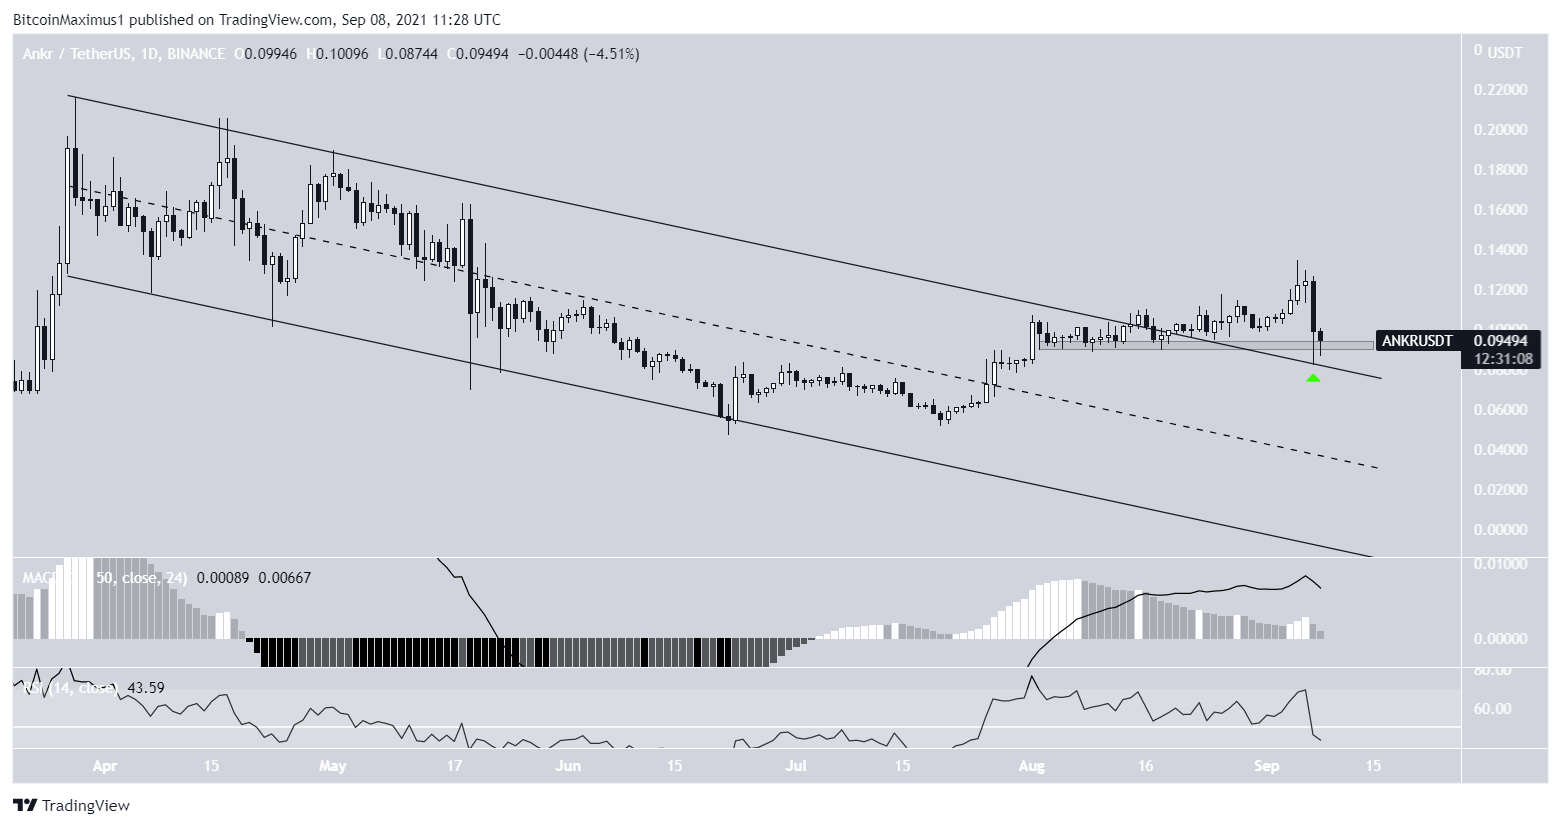
ANKR had been trading inside a descending parallel channel since reaching an all-time high price on March 28. On Aug. 23, it managed to break out.
While the token initiated an upward movement it started to fall on Sept. 5.
On Sept. 8, it returned in order to validate the resistance line of the channel as support (green icon). This also coincided with a validation of the $0.092 horizontal area as support.
Despite the fact that the price action looks like a resistance/support flip, technical indicators are turning bearish. The RSI has fallen below 50 and the MACD is nearly negative.
CHZ
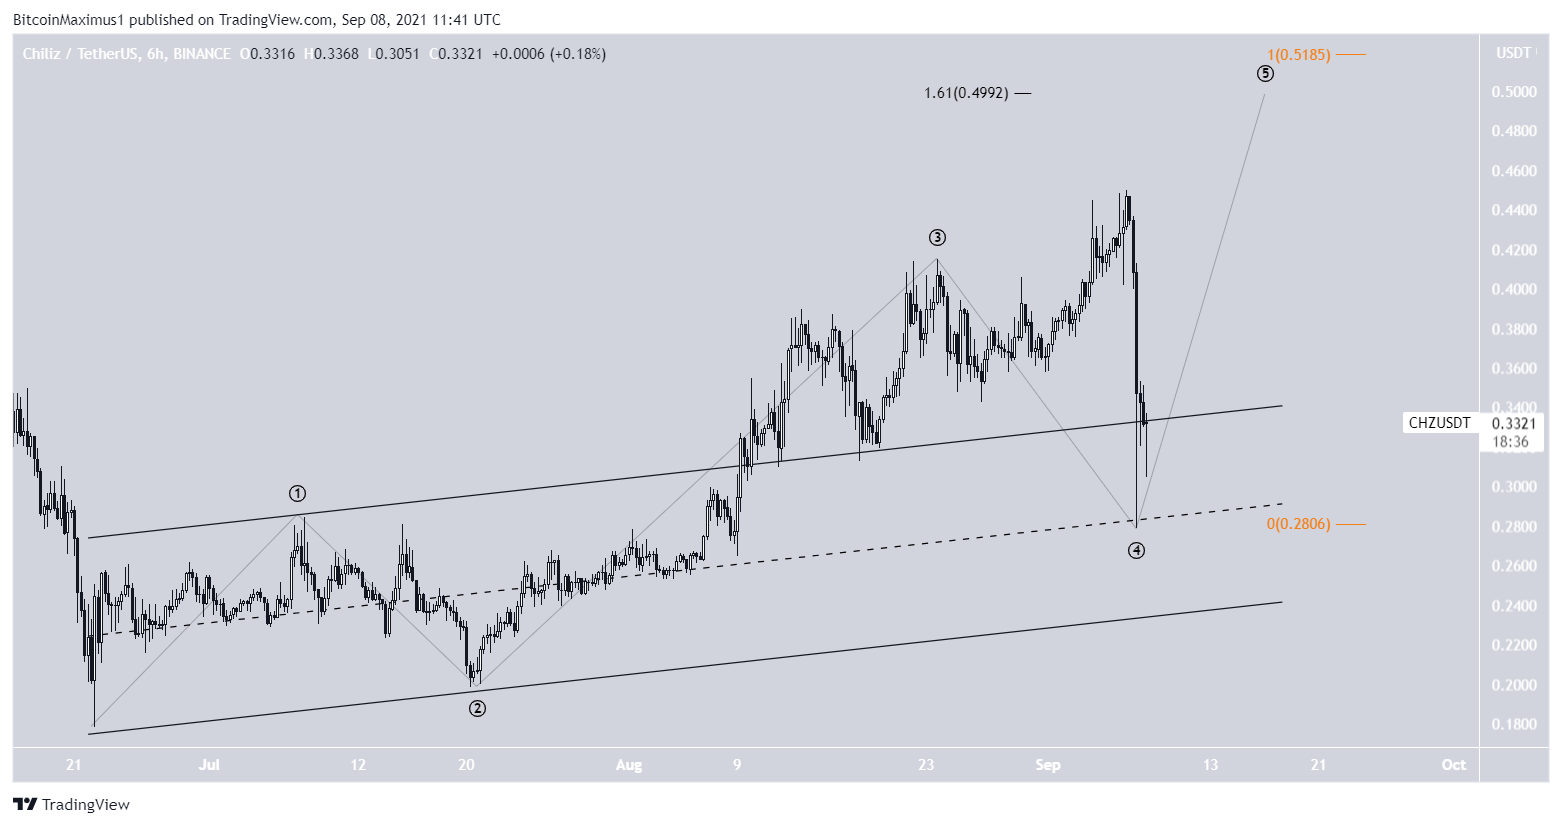
CHZ has been increasing inside an ascending parallel channel since July 20. On Aug. 9, the token broke out and proceeded to reach a high of $0.447 on Sept. 7. However, it fell sharply immediately afterwards.
Similarly to IOTA, it is possible that CHZ has completed a fourth wave pullback. If correct, the most likely target for the top of the upward movement is near $0.50. The target is found using the 1.61 external Fib retracement (black) of the most recent drop and the length of waves 1-3 (orange).
For BeInCrypto’s latest Bitcoin (BTC) analysis, click here.
Disclaimer
All the information contained on our website is published in good faith and for general information purposes only. Any action the reader takes upon the information found on our website is strictly at their own risk.
Source: https://beincrypto.com/technical-analysis-sept-8-btc-eth-xrp-enj-iota-ankr-chz/
- 11
- 7
- 9
- Action
- All
- analysis
- analyst
- AREA
- AUGUST
- barcelona
- bearish
- Black
- breakout
- BTC
- Creating
- cryptocurrencies
- cryptocurrency
- data
- day
- discovered
- Drop
- Economics
- ETH
- Finally
- financial
- General
- good
- graduate
- Green
- High
- HTTPS
- ICON
- Increase
- information
- IOTA
- IT
- July
- Led
- Level
- Line
- local
- Long
- March
- Markets
- move
- Near
- order
- price
- Reader
- Risk
- School
- started
- successful
- support
- support level
- Target
- Technical
- Technical Analysis
- token
- top
- Trading
- Wave
- waves
- Website
- websites
- writing
- xrp
- youtube


