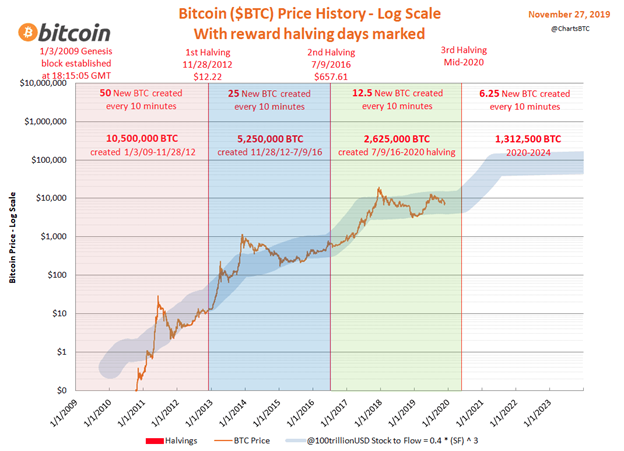
Nick here: I’m traveling at press time, but I was talking with Tom and he felt pretty strongly that he should get this Microcurrency Trader chart out to as many people as possible in the wake of serious selling in BTC and ETH following the FTX debacle. Here’s Tom…
If you didn’t know any better, you’d think crypto – including the majors like Bitcoin (BTC) and Ether (ETH) – has been in a death spiral. Those two coins alone have lost as much as 15% and 25% of their value, and the total market cap of all cryptos is sitting at right around $850 billion, barely above June 2022 lows of $800 billion.
There’s no mystery about the bad news. Sam Bankman-Fried, who at one point was celebrated as the white knight of crypto investors is out over at FTX – and FTX itself has declared bankruptcy, due to some allegedly unsound accounting and trading practices.
The news has prompted Bitcoin to break out of its June to October trading range… to the downside, unfortunately. It’s the oldest and most popular coin, representing about 40% of the entire Microcurrency market.
Like a lot of traditionally “risk-on” assets the coin has sold off, breaking important long-term support at $30,000 and falling straight to the next major support level we identified at $20,000 per coin.
Take a look:
After testing and retesting $20,000 over the past several months, BTC is beginning to break down in price, as the coin sits just over $16,000 at the time of writing.
I’ll be the first to admit, at first glance, Bitcoin looks bad here. It’s certainly not pretty. But, if you zoom out a little bit, and let history be your guide, you realize most of the selling is probably over.
But that’s “probably.” If Bitcoin hasn’t found its bottom, it could come in the $10,000 to $11,000 range, which is around 40% below today’s prices. So, worst-case scenario: we get a chance to own Bitcoin at $10,000.
Its all-time highs were at $69,000, and there’s a “halving event” coming in 2024. Historically, Bitcoin realizes new all-time highs within 18 months of those halvings, and I don’t have any reason to expect this one to be different. A trip from $10,000 back to $69,000 would be a 590% gain from here, and from those highs, the sky’s the limit. That’s a great risk/reward picture.

There’s Ether (ETH) to think about, too. After BTC, ETH is the second-largest coin, representing about 20% of the market. It’s also a bellwether of other, smaller “alt” coins, many of which use its blockchain. In the short-term, whether ETH is underperforming or outperforming BTC tells us the state of how other “alt” coins are doing.
Over the past week, ETH underperformed BTC, losing 25%. And after once again finding resistance at $2,000 this summer, the coin remains down 40% from its recent swing highs… This is a big improvement from recent weeks, and we’ll continue paying especially close attention to it over the coming weeks to see if it can start to build strength and lead the smaller coins that use ETH technology out of this bear market.
A solid break below its recent lows could take us into our next big leg down in the microcurrency market, and a sharp rally above its August highs could mean the low is in for most coins and a new bull market, so stay tuned!
- AICI Daily
- aicinvestors
- American Institute for Crypto Investors
- Bitcoin
- blockchain
- blockchain compliance
- blockchain conference
- coinbase
- coingenius
- Consensus
- crypto conference
- crypto mining
- cryptocurrency
- decentralized
- DeFi
- Digital Assets
- ethereum
- machine learning
- non fungible token
- plato
- plato ai
- Plato Data Intelligence
- Platoblockchain
- PlatoData
- platogaming
- Polygon
- proof of stake
- W3
- zephyrnet


