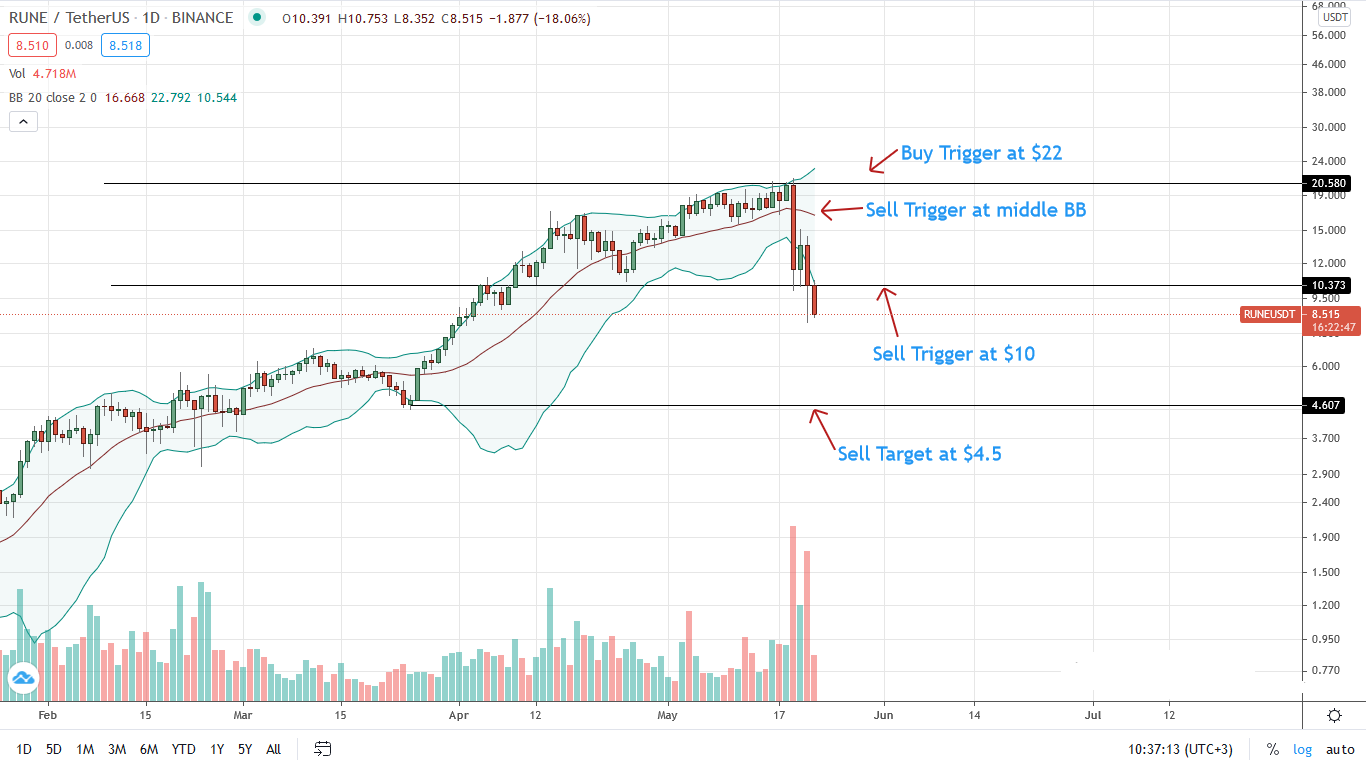
Chainlink and ThorChain prices are under pressure. LINK/USDT and RUNE/USDT may slide to $13 and $4.5, respectively, in bear trend continuation following this week’s steep losses.
Chainlink (LINK)
The Chainlink blockchain agnostic platform is the go-to oracle provider and critical in DeFi. Behind the dApp is LINK, a utility and governance token.
Past Performance of LINK
The LINK price is under pressure, cratering below crucial support levels as bears take charge after over ten months of exemplary performance.
LINK is down double digits versus BTC and USD on the last trading day, losing 15 percent.
It is relatively stable against ETH, losing four percent. Meanwhile, trading volumes are steady at $2.8 billion.
Day-Ahead and What to Expect
The path of the least resistance is southwards if LINK/USDT technical analysis on the daily and weekly chart leads.
Presently, the double-bar bear reversal pattern of the last two weeks has been validated after this week’s losses.
Additionally, the rapidity of this week’s losses means LINK/USDT is below the 20-week moving average, a primary support level.
LINK/USDT Technical Analysis
LINK/USDT bears are firmly in control. Losses below $30 and $25 revealed the strength of bears.
In a bear breakout pattern, every pullback below $25 opens up LINK/USDT for $13.
ThorChain (RUNE)
The protocol allows the trustless, non-custodial trading of various digital assets across different blockchains. Its main currency is RUNE.
Past Performance of RUNE
RUNE prices, after incredible gains in Q4 2020 and Q1 2021, are not retreating. RUNE is down a ballpark 25 percent against BTC and USD.
At the same time, it is down 17 versus ETH.
Besides, the downtrend is a spike in trading volumes, pointing to traders possibly exiting their long positions.
Day-Ahead and What to Expect
RUNE/USDT technical analysis reveals weakness and bears pressing lower.
There has been confirmation of deep losses early this week as traders possibly exit and take profit.
Following this rapid draw-down, RUNE prices have broken below $10 and may sink in the days ahead.
RUNE/USDT Technical Analysis
From the daily chart, sellers are in charge of proceedings.
Notably, traders might be panicky, exiting their longs as bear candlesticks print.
RUNE is now below two support lines—the middle BB and $10.
Accordingly, every pullback might be a loading opportunity with immediate targets at $4.5 in the coming days.
- "
- 2020
- active
- analysis
- Assets
- Bears
- Billion
- blockchain
- border
- breakout
- BTC
- Chainlink
- chainlink (link)
- charge
- coming
- Currency
- dapp
- day
- DeFi
- digital
- Digital Assets
- digits
- Early
- ETH
- Exit
- Federal
- federal reserve
- Figure
- governance
- Governor
- HTTPS
- IT
- Level
- LINK
- Long
- months
- opens
- Opportunity
- oracle
- Pattern
- performance
- platform
- Posts
- pressure
- price
- Profit
- Q1
- Sellers
- Status
- support
- support level
- Technical
- Technical Analysis
- time
- token
- Traders
- Trading
- USD
- utility
- VanEck
- Versus
- week
- weekly


