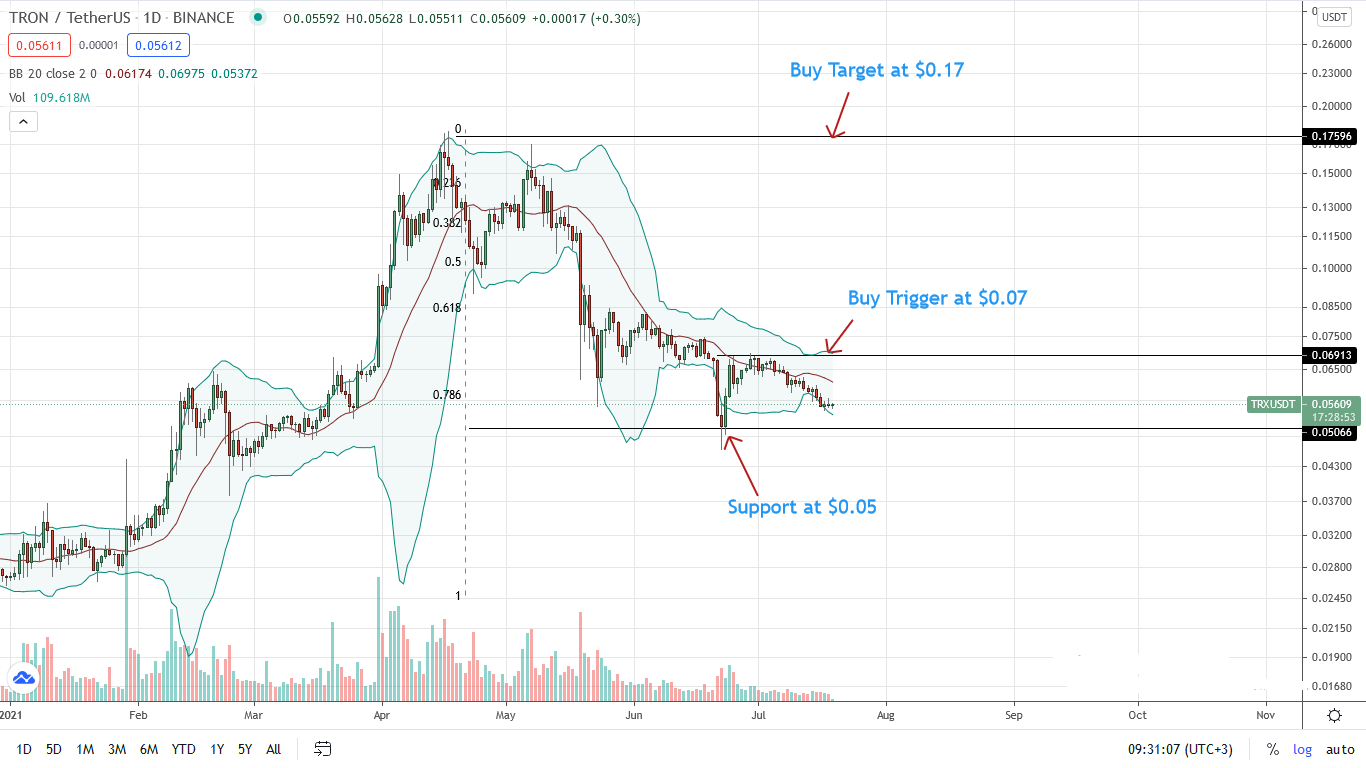
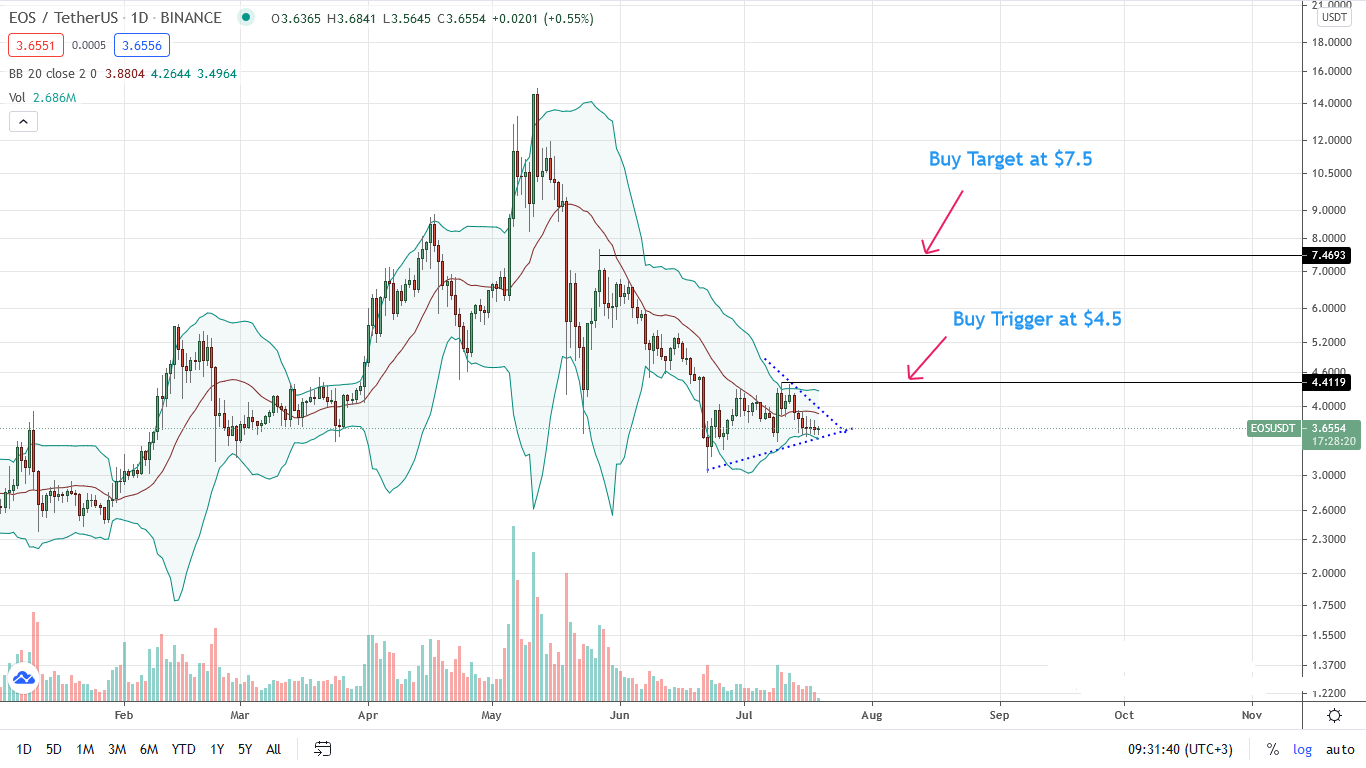
Tron and EOS prices are boxed inside tight trading ranges. A close above $4.5 could see EOS/USDT surge to $7.5. On the other hand, TRX/USDT prices are solid above $0.05.
Tron (TRX)
The EVM-compatible platform is one of the most popular for building dApps, including those focused on DeFi. TRX is its native currency.
Past Performance of TRX
The TRX coin is under pressure, down over 70 percent from 2021 peaks, as bears press.
Even though prices are now flat-lining as TRX drops one percent on the last trading day, bears are technically in control.
This could change if the three-bar bullish reversal pattern from July 16 to 18 forms a solid base for buyers.
Day-Ahead and What to Expect
Overly, the trend is southwards. Sellers could press lower if TRX supports crash.
At present, TRX/USDT prices are in a $0.02 range, with identifiable support at $0.05 and resistance at $0.07.
Ideally, a close above the middle BB in the daily chart would mark bottoms and possible revival once a follow-through of the June 23 gains.
TRX/USDT Technical Analysis
As of writing, TRX/USDT prices are printing higher highs relative to the lower BB, a bullish signal.
Still, the trend remains southwards provided TRX/USDT is below $0.07 and the middle BB.
However, since TRX/USDT prices are inside June 23 and 24 bull bars, aggressive traders may find loading opportunities in lower time frames targeting $0.07.
Losses below $0.05 could see TRX slump to $0.02.
EOS
The dPoS blockchain is active and the home of gaming and gambling dApps. EOS is native to the platform.
Past Performance of EOS
EOS/USDT prices are inside a descending wedge below the middle BB.
Overly, EOS traders are confident.
Nonetheless, without substance, EOS sellers will continue dominating, pouring cold water on all bullish attempts in the days ahead.
Presently, the price is stable, dropping two percent on the last trading week.
Day-Ahead and What to Expect
Technical indicators point to sellers.
Specifically, the middle BB is a critical resistance—former support— that must be comprehensively broken for buyers to out-muscle sellers.
Beyond that, $4.5 is the primary liquidation line and a buying trigger for optimistic traders.
EOS/USDT Technical Analysis
EOS prices are inside a descending wedge and primarily within June 21 and 22 bear bars.
Aforementioned, sellers are in charge. Therefore, if EOS collapses below the minor trend line, prices could sink to 2020 lows of around $2.5.
On the flip side, gains above $4.5 could trigger a buying wave, lifting EOS/USDT towards $7.5.
Source: https://www.cryptoknowmics.com/news/tron-trx-and-eos-technical-analysis-what-to-expect
- "
- 2020
- active
- All
- analysis
- around
- bars
- Bears
- blockchain
- border
- Building
- Bullish
- Buying
- change
- charge
- Coin
- continue
- Crash
- Currency
- DApps
- day
- DeFi
- Dollar
- EOS
- Figure
- Gambling
- gaming
- Gold
- Home
- HTTPS
- Including
- July
- Line
- Liquidation
- mark
- Most Popular
- Oil
- Other
- Pattern
- performance
- platform
- Popular
- Posts
- present
- press
- price
- range
- security
- security token
- Sellers
- substance
- support
- Supports
- surge
- Technical
- Technical Analysis
- time
- token
- Tokens
- Traders
- Trading
- TRON
- TRON (TRX)
- TRX
- Watch
- Water
- Wave
- week
- within
- writing


