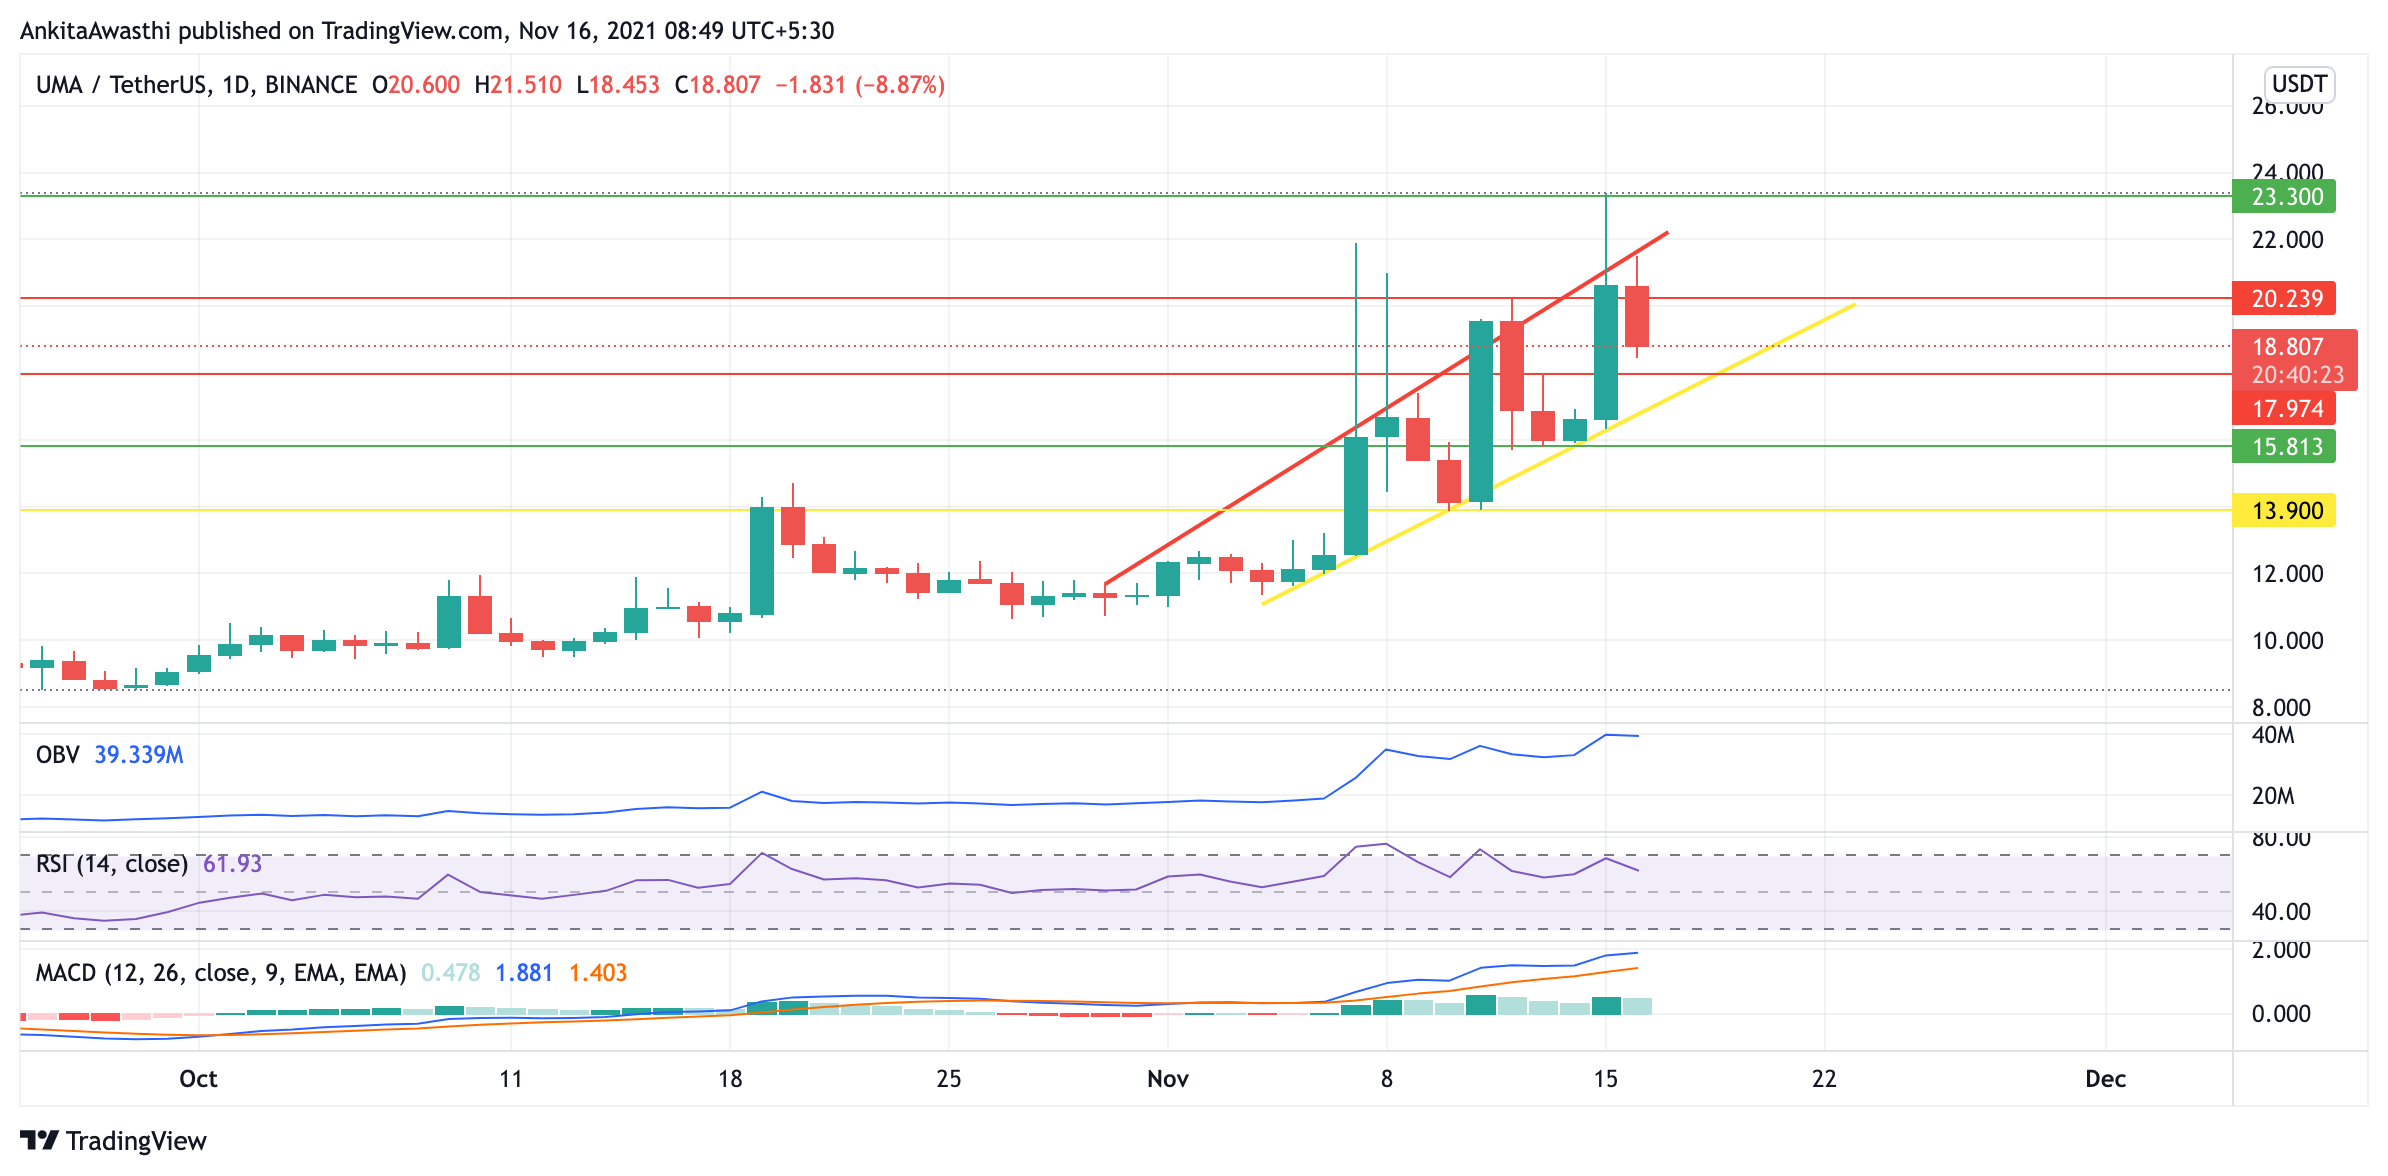
UMA, or Universal Market Access, is a protocol for the creation of synthetic assets based on the Ethereum (ETH) blockchain. UMA was launched in December 2018. The main idea behind Universal Market Access is reflected in its name: by developing a protocol for the creation of synthetic assets and financial contracts on the blockchain, it seeks to democratize and decentralize the financial derivatives market.
Let us look at the technical analysis of UMA.
Past Performance
Since its ICO, the UMA coin has never traded below its listing price of $1.2. However, the price has shown volatility as hills can be seen in the price chart. At the beginning of the year, in February 2021, the price chart also witnessed a sudden increase, which continued for about 3 months of high volatility, after which a correction was seen in May 2021.
UMA’s opening trade on November 9, 2021, took place at $16.69, while it closed on November 15, 2021, at $20.52. This was a weekly change of 22.94%.

UMA Technical Analysis
The UMA price is currently restricted between inclined resistance and inclined support. This is creating predictable volatility, which may benefit intraday traders. Currently, the price has hit the resistance and is moving towards support. Let us look at what the indicators are showing.
Continuous hills can be seen in the OBV graph, which is in alignment with the price chart. Today, the selling volumes are greater than the buying volumes, thus driving the price down.
Currently, at 61.83%, the RSI is also showing a decrease in the strength of the bulls today. This is again a signal that the price will reduce today.
The MACD graph is reflecting the ongoing general uptrend, as both the fast line and the slow are positive. No divergence can be seen in the MACD graph from the price chart.
UMA has a service known as Optimistic Oracle. It allows contracts to quickly request and receive any kind of data. The Optimistic Oracle acts as a generalized escalation game between contracts that initiate a request and UMA’s dispute resolution system known as the Data Verification Mechanism (DVM).
Day-Ahead and Tomorrow
In the last 4 months, UMA has shown a growing trend. Thus, we think that similar parts of the market were quite popular at that period. According to the latest data collected, the trading volume of UMA is increasing for the last 4 months. The trading volume constitutes a vital role in its price.
The Fibonacci retracement is showing that the price chart is taking support and facing resistance at various Fib pivots. Currently, it is being tested around the pivot at $19.24.
Thus, the indicators are showing that the price is likely to fall in today’s intraday sessions. If the price falls below the current inclined support, then a downtrend may be seen, and the traders may keep a stop-loss at $15.813. However, if the price starters to increase in the coming days, and breaks the inclined resistance, then the traders may keep a target at $23.3.
- 11
- 7
- 9
- access
- analysis
- around
- Assets
- blockchain
- Bulls
- Buying
- closed
- Coin
- coming
- contracts
- Creating
- Current
- data
- Derivatives
- Dispute
- driving
- ETH
- ethereum
- ethereum (ETH)
- facing
- FAST
- financial
- Financial Derivatives
- game
- General
- Growing
- High
- HTTPS
- ICO
- idea
- Increase
- IT
- latest
- Line
- listing
- Market
- months
- oracle
- Pivot
- Pivots
- Popular
- price
- protocol
- reduce
- support
- system
- Target
- Technical
- Technical Analysis
- trade
- Traders
- Trading
- Universal
- us
- Verification
- Volatility
- volume
- year


