Published 10 hours ago
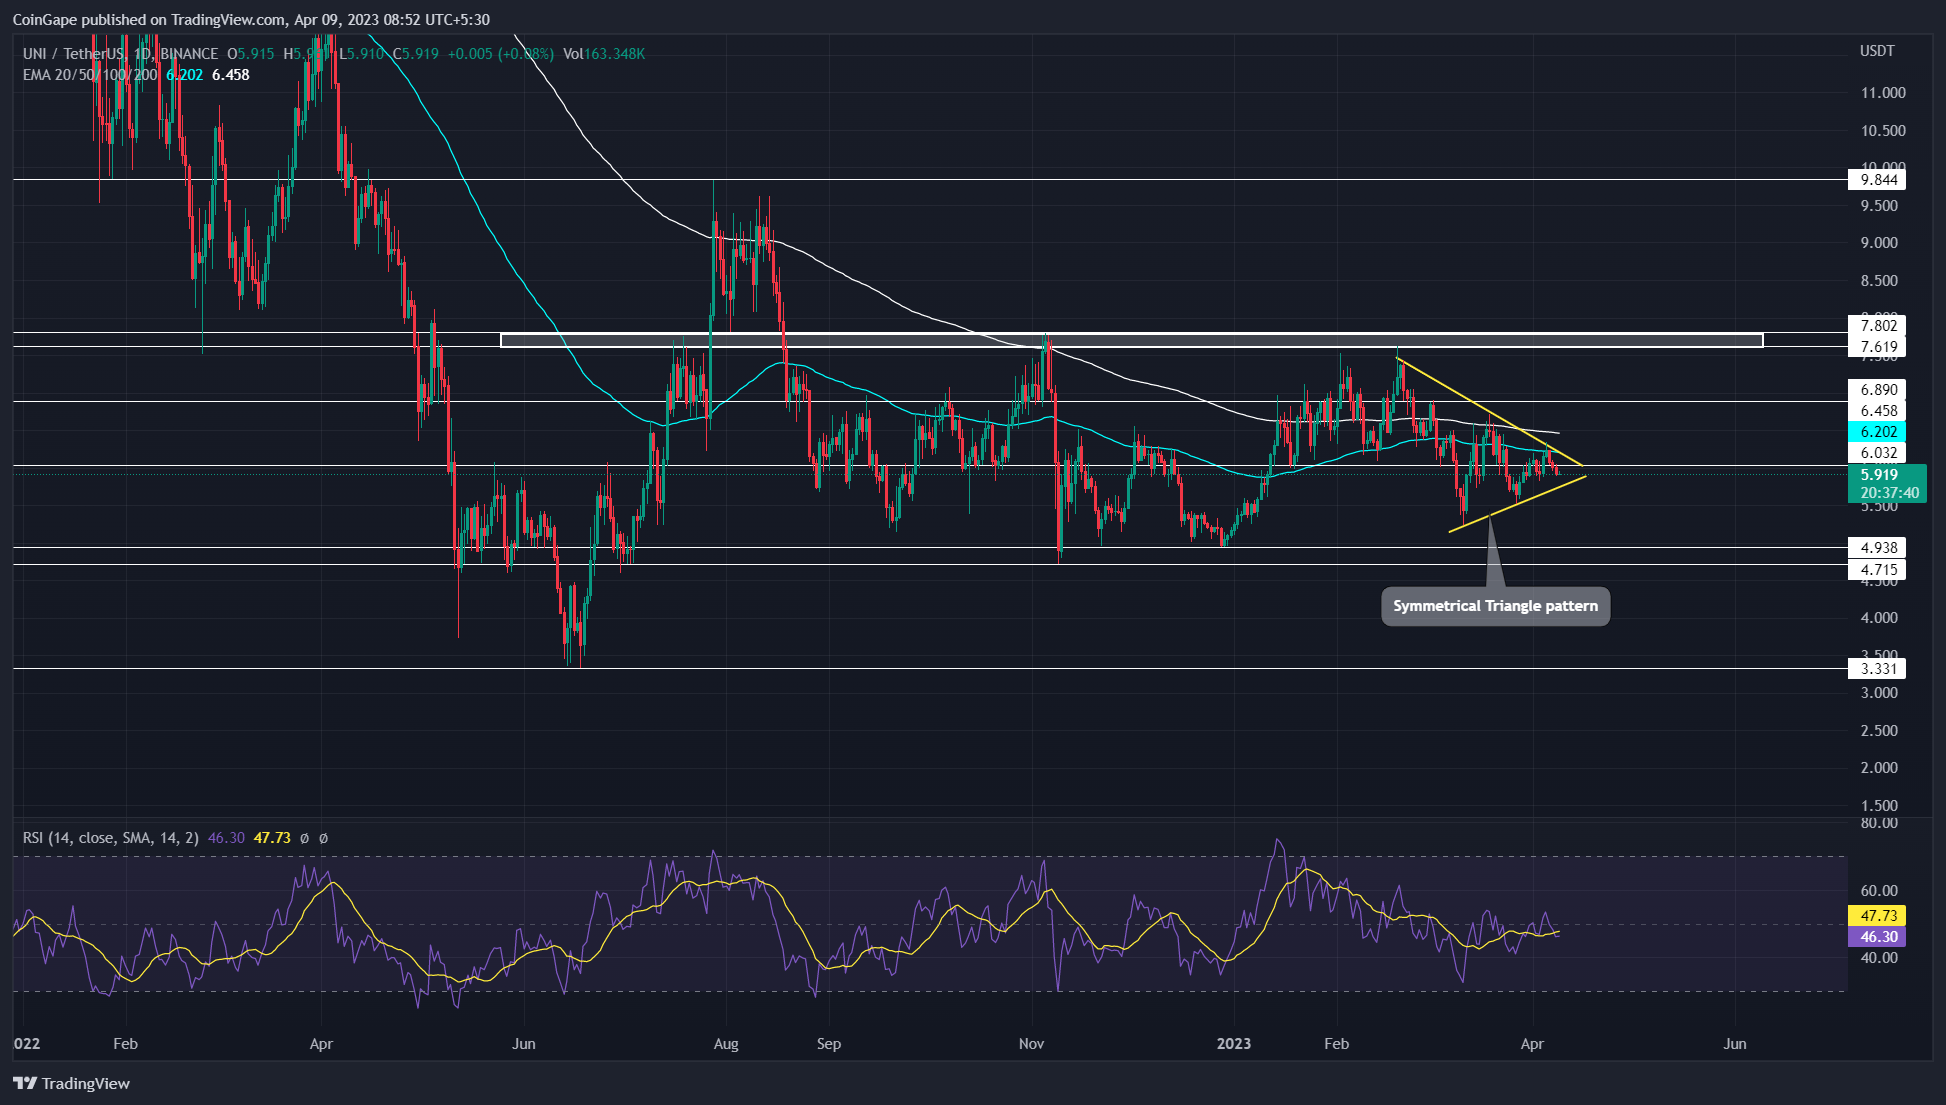
UNI Price Prediction: With broader market sentiment struggling in uncertainty, the Uniswap coin price is resonating within two converging trendlines, revealing the formation of a symmetrical triangle pattern. Currently, this pattern can be considered a neutral pattern whose breakout will determine the future trend of UNI price. Here’s how you may profit from trading this pattern.
advertisement
Key Points:
- The area within the triangle pattern has been squeezed to be marked as no trading zone.
- Interested traders must for a breakout opportunity to get a clear picture of upcoming movement.
- The 24-hour trading volume in the Uniswap token is $67 Million, indicating a 6% gain.

 Source-Tradingview
The Uniswap price has been in a sideway trend for the past eight months wobbling between the buying climax at $7.8 and the selling climax at $4.9-$.4.7. However, within this confined range, the UNI price action gets more squeezed within two converging trendlines of the symmetrical triangle pattern.
The coin price rebounded thrice from the upper trendline thrice and lower resistance twice indicating the traders are respecting this pattern’s setup. As of now, the UNI/USDT pair trades at the $5.9 mark, with an intraday loss of 1.4%, and the prices are moving towards the lower support trendline.
Trending Stories
Also Read: Top 6 Liquid Staking Platforms On Ethereum
Thus, a potential breakdown below the lower trendline with the daily candle closing below will increase the selling pressure and tumble the coin price 20% to hit the $4.7 support.
On a contrary note, a breakout from the overhead trendline will release the trapped bullish momentum and drive the UNI price 30% up to reach the $7.8 mark
Technical indicator
EMAs: the flattish EMAs(20, 50, 100, and 200) accentuate an overall sideways trend.
RSI indicator: despite a lower high peak price action, the daily RSI slope moving sideways indicates growth in underlying bullish momentum and a higher possibility for the triangle’s upside breakout.
Uniswap Intraday Price Levels
- Spot price: $6.22
- Trend: bullish
- Volatility: High
- Resistance levels- $7, $8
- Support levels- $5.66 and $5.2
Share this article on:
advertisement
The presented content may include the personal opinion of the author and is subject to market condition. Do your market research before investing in cryptocurrencies. The author or the publication does not hold any responsibility for your personal financial loss.
<!– Close Story–>
- SEO Powered Content & PR Distribution. Get Amplified Today.
- Platoblockchain. Web3 Metaverse Intelligence. Knowledge Amplified. Access Here.
- Source: https://coingape.com/markets/uni-price-prediction-this-pattern-decide-if-uniswap-price-rally-30-or-tumble-20/
- :is
- $UP
- 1
- 10
- 100
- 7
- 8
- 9
- a
- Action
- Ad
- and
- Apple
- ARE
- AREA
- article
- AS
- At
- author
- avatar
- banner
- BE
- Beauty
- before
- below
- between
- blockchain
- Breakdown
- breakout
- Brian
- broader
- Bullish
- Buying
- CAN
- Chart
- clear
- closing
- Coin
- Coingape
- COM
- condition
- considered
- content
- contrary
- converging
- could
- cryptocurrencies
- cryptocurrency
- Currently
- daily
- decide
- Despite
- Determine
- different
- drive
- Entertainment
- Fashion
- finance
- financial
- follow
- For
- formation
- from
- future
- Gain
- get
- Growth
- Have
- High
- higher
- Hit
- hold
- HOURS
- How
- However
- HTTPS
- i
- in
- include
- Including
- Increase
- indicates
- Indicator
- investing
- journalism
- jpg
- Last
- Liquid
- liquid staking
- loss
- mark
- marked
- Market
- market research
- market sentiment
- million
- Momentum
- months
- more
- movement
- moving
- Neutral
- of
- on
- Opinion
- Opportunity
- overall
- past
- Pattern
- Peak
- personal
- picture
- Platforms
- plato
- Plato Data Intelligence
- PlatoData
- plugin
- points
- possibility
- potential
- prediction
- presented
- pressure
- price
- PRICE ACTION
- Price Prediction
- Prices
- Profit
- Publication
- rally
- range
- reach
- Read
- release
- research
- Resistance
- respecting
- responsibility
- revealing
- rsi
- Selling
- sentiment
- setup
- Share
- sideways
- Staking
- Struggling
- subject
- support
- Symmetrical Triangle
- The
- The Future
- to
- token
- Topics
- towards
- Traders
- trades
- Trading
- trading volume
- TradingView
- Trend
- trending
- Twice
- Uncertainty
- underlying
- UNI
- UNI price
- Uniswap
- upcoming
- Upside
- variety
- volume
- will
- with
- within
- working
- written
- years
- You
- Your
- zephyrnet


