TL;DR Breakdown
- The Uniswap price analysis shows a bearish trend
- UNI/USD prices have established strong support at $11.12
- Uniswap prices likely to break lower

The Uniswap price analysis reveals that UNI prices are currently trading at $11.26 after recording a 2.10 percent decline over the past 24 hours. The total UNI volume traded for UNI tokens stands at $456,551,079.8 while the market capitalization currently stands at $7 billion whereby UNI prices have been hovering between a range of $11.12 and $11.50 over the past few days.
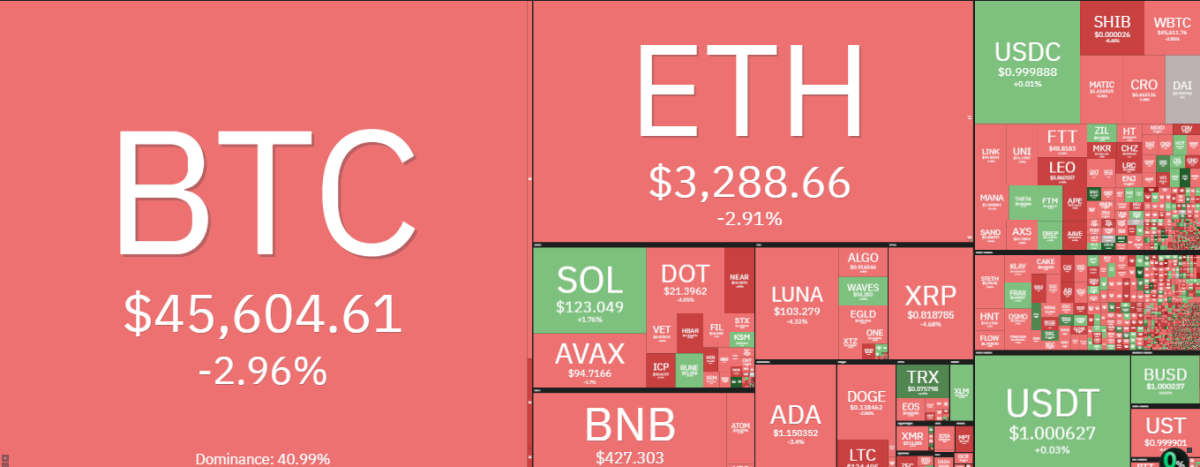
The UNI/USD pair is likely to break lower in the short term as the prices have been unable to sustain a higher level. The bears continue to dominate the market momentum as the selling pressure is increasing. The support level at $11.12 is likely to be tested in the near future. If the bears are able to break this support, the prices could decline further to the next support level at $10.50.The overall market sentiment remains bearish as most of the altcoin prices are trading in the red.
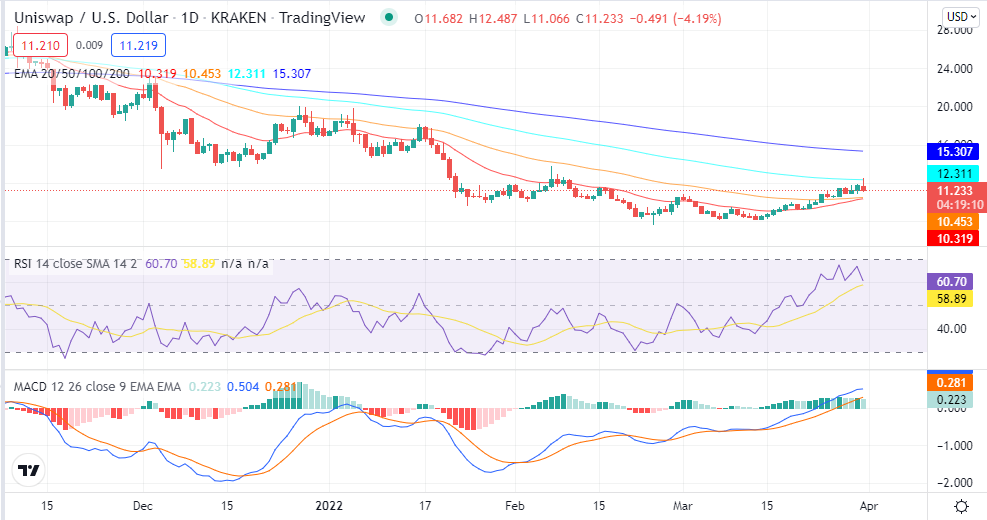
Uniswap price analysis on a 1-day price chart: UNI/USD prices break below $11.12 support
The UNI/USD pair has broken below the support at $11.12 and is currently trading at $11.27. The prices are oscillating below the 20-day EMA and the RSI is below 50, which suggests that the bears are in control of the market. The next support level is at $10.50, below which the prices could decline to $9.00. On the other hand, if the bulls manage to push the prices above $11.50, a retest of the resistance at $12.50 is likely.

Uniswap prices are likely to trade lower as indicated by the MACD line that is currently residing in the negative territory. The prices could decline to the next support at $10.50 in the near future. The Fibonacci retracement level shows that the prices have found support at the 61.8 percent Fibonacci retracement level and are likely to break lower in the short term. The prices are likely to break lower in the near future as the selling pressure increases.
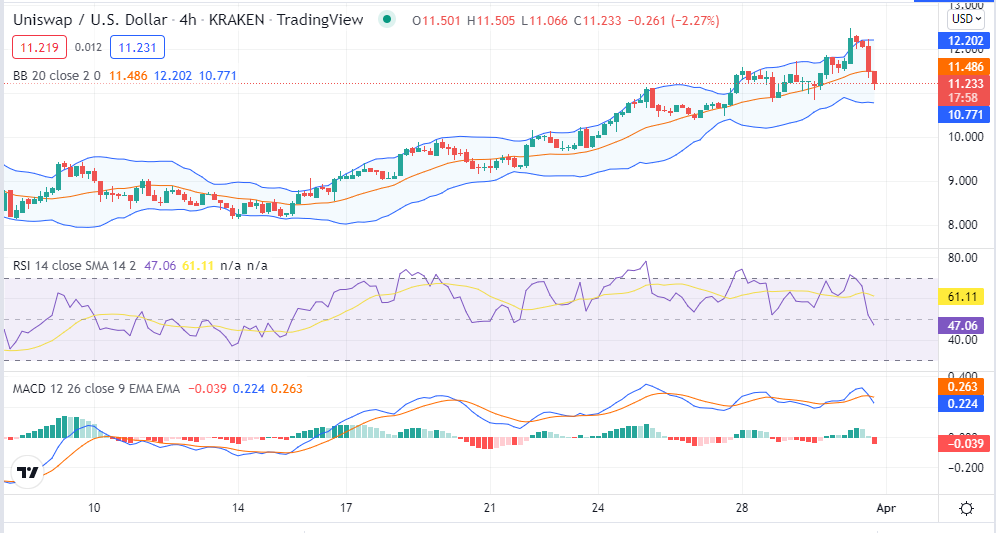
Uniswap price action on a 4-hours price chart: Recent developments and further technical indications
Looking at the 4-hour price chart, a further downtrend is anticipated in the market as the prices try to break below the $11.12 support level. The bears are having the upper hand and they are focused on breaking below the support levels. The RSI is below 50, which indicates that the sellers are in control of the market. The next support level is $10.50, followed by $9.00. If the buyers are able to push the prices above $11.50, a retest of the resistance at $12.50 is likely.

The 50 days EMA is sloping down and is positioned below the 200 days EMA, which suggests that the long-term trend is bearish. The MACD line is in the negative territory and it is likely to cross below the signal line in the near future, which will indicate a further decline in the prices. However, the Bollinger bands are indicating the current level of volatility and they are expanding, which suggests that a big move is likely in the near future.
Uniswap price analysis conclusion
The overall market sentiment remains bearish as the prices are following a declining trendline where prices are seen to be dropping beyond the previous support levels. The Uniswap price analysis shows that the current market trend is likely to send UNI/USD prices drop further to the next support at $10.50 in the near future. However, a breakout upward would see UNI prices retest the resistance at $11.50-$12.50 in the short-term if the bulls will put more pressure.
Disclaimer. The information provided is not trading advice. Cryptopolitan.com holds no liability for any investments made based on the information provided on this page. We strongly recommend independent research and/or consultation with a qualified professional before making any investment decisions.
- 10
- Action
- advice
- Altcoin
- analysis
- bearish
- Bears
- Billion
- breakout
- Bulls
- buyers
- capitalization
- continue
- control
- could
- Current
- developments
- down
- Drop
- EMA
- established
- expanding
- focused
- follow
- following
- found
- further
- future
- having
- higher
- holds
- HTTPS
- increasing
- information
- investment
- Investments
- IT
- Level
- liability
- likely
- Line
- long-term
- made
- Making
- Market
- Market Capitalization
- Momentum
- more
- most
- move
- Near
- Other
- positioned
- pressure
- price
- Price Analysis
- professional
- qualified
- range
- recommend
- research
- Sellers
- sentiment
- Short
- stands
- strong
- support
- support level
- Technical
- Tokens
- trade
- Trading
- Uniswap
- Volatility
- volume
- while
- would


