VeChain promises a lot of potential, but the valuation of this cryptocurrency has been falling in close to double digits for the last few days. What does this price action indicate? Despite the huge potential in the creativity behind the application of VeChain, the actual value is moved by investor sentiment & progression in the cryptocurrency.
Currently, VeChain has broken multiple support levels in both small and large time frames. This situation indicates a substantial weakness, but how much more VET will fall before recuperating some of its losses is a question controlling investor action. Let us learn more about the possibilities by reading the popular technical indicators.
VeChain Technical Analysis

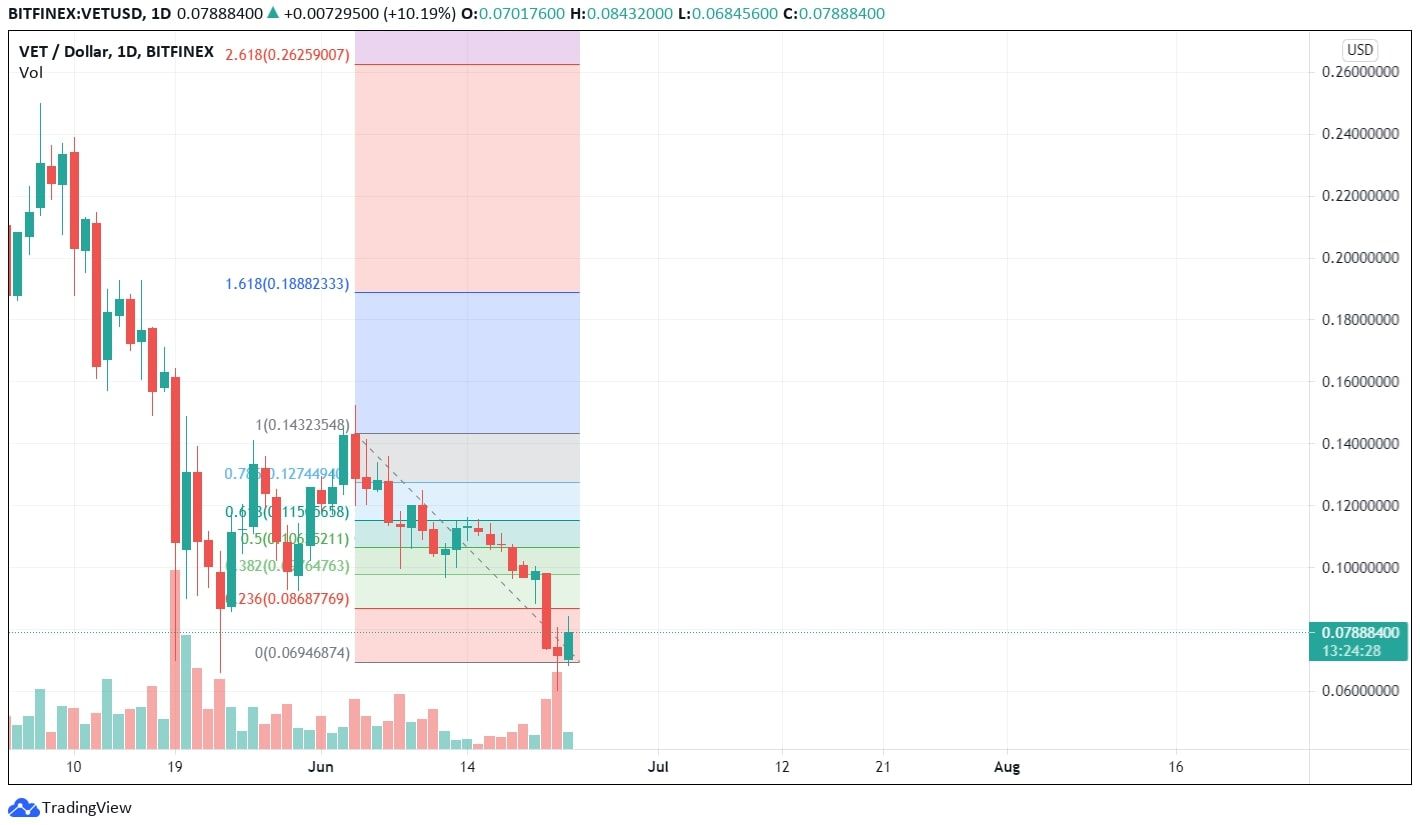
VeChain or VET has been downwind since the start of May and witnessed two heartbreaking falls, one on 10th May when VeChain fell from its monthly high of close to $0.25 to less than $0.10. Another disastrous fall was noted on 21st June when it fell more than 22%. These are an indication of investors closing their holding positions. With the fall in prices, there has been a sudden rise in volumes too.
There is strong support at $0.06 levels as a historical buying level, while the similar resistance is active around the $0.15 levels. Vechain breaching both long moving average lines raises serious eyebrows about the future price action, but the support taken from $0.06 levels have provided some break to the falling prices.
RSI is acting similarly with some reversal from the oversold zones; it currently shows a value of 35.91 at the histogram. The reversal could be witnessed on the broader crypto assets and converges as good news for the constantly falling valuations. For the short term, the price action seems to have been directed towards retracements.

VeChain fall is close to the first retracement level of 23%. Generally, a retracement over 38% is considered a sign of strength, and a failure to stay above the 23% retracement valuations is a sign of weakness.

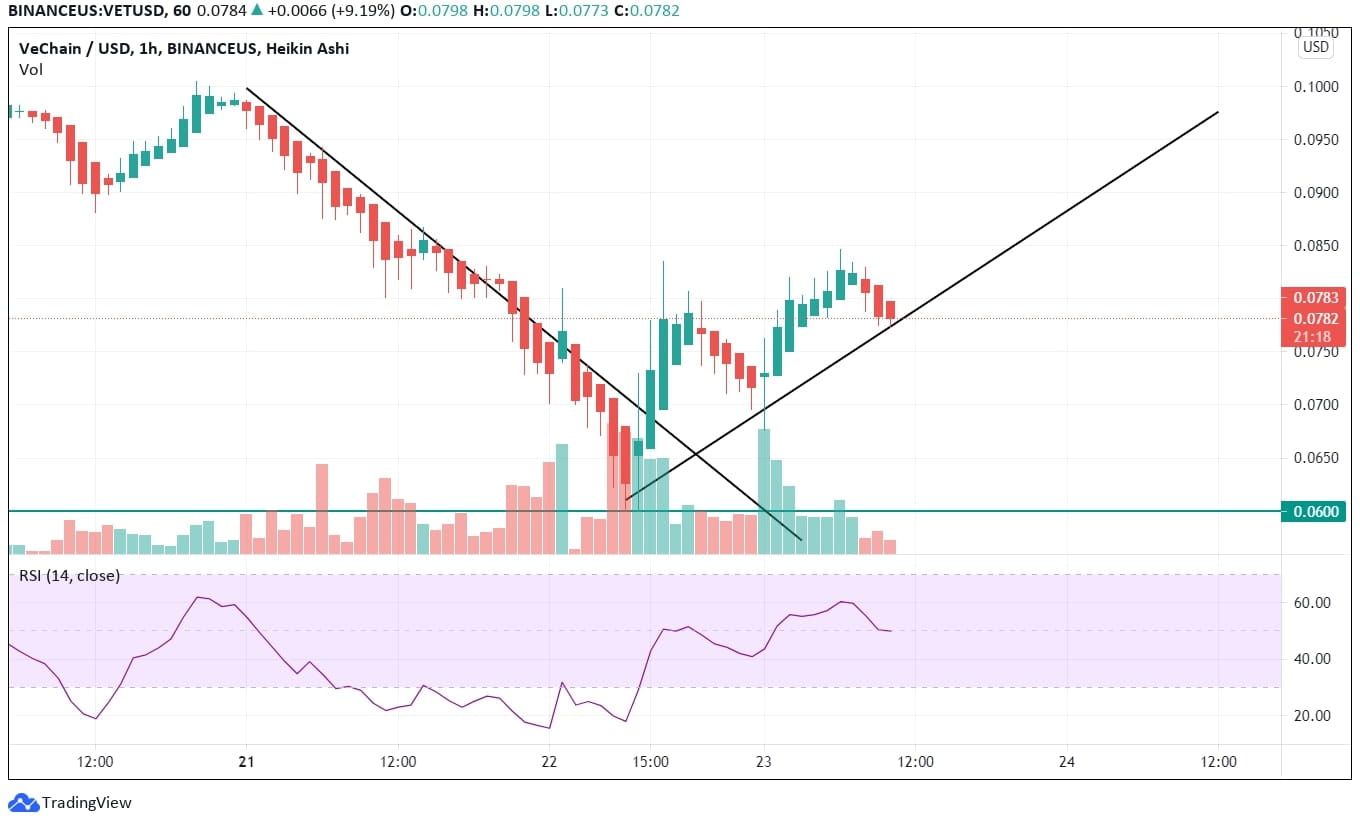
VeChain on an hourly chart shows good strength; considering the following trend line, it is obvious that it fell along an angled line but is currently trying to recuperate its intraday losses for the last two days. Despite forming red candles in the last three hours, it can be witnessed that the current low is above the previous low created 12 hours ago. Hence, VeChain shows some signs of upside and can enter this cryptocurrency if it respects the new trend line. RSI on hourly charts is showing a histogram level of 52, indicating a neutral to a positive outlook.
Although, if you are planning to invest in this cryptocurrency, you must check VET price prediction first so that you can decide accordingly. As per the above discussion, we can hope for good signs in its price, so keep your eyes on it to grab the best opportunity.
Source: https://www.cryptonewsz.com/vechain-breaks-200-day-moving-average/
- &
- Action
- active
- analysis
- Application
- around
- Assets
- BEST
- Buying
- Charts
- crypto
- cryptocurrency
- Current
- day
- digits
- Failure
- First
- future
- good
- grab
- High
- How
- HTTPS
- huge
- investor
- Investors
- IT
- large
- LEARN
- Level
- Line
- Long
- news
- Opportunity
- Outlook
- planning
- Popular
- price
- raises
- Reading
- sentiment
- Short
- Signs
- small
- So
- start
- stay
- support
- Technical
- Technical Analysis
- time
- us
- Valuation
- Valuations
- value
- VeChain


