Coinidol.com weekly cryptocurrency price analysis from GMX, MNT, XDC, OP and BONE.
Altcoins are under renewed selling pressure as they are rejected from recent highs. For example, GMX, XDC, and BONE all have false breakouts as cryptocurrency resumes selling pressure.
GMX
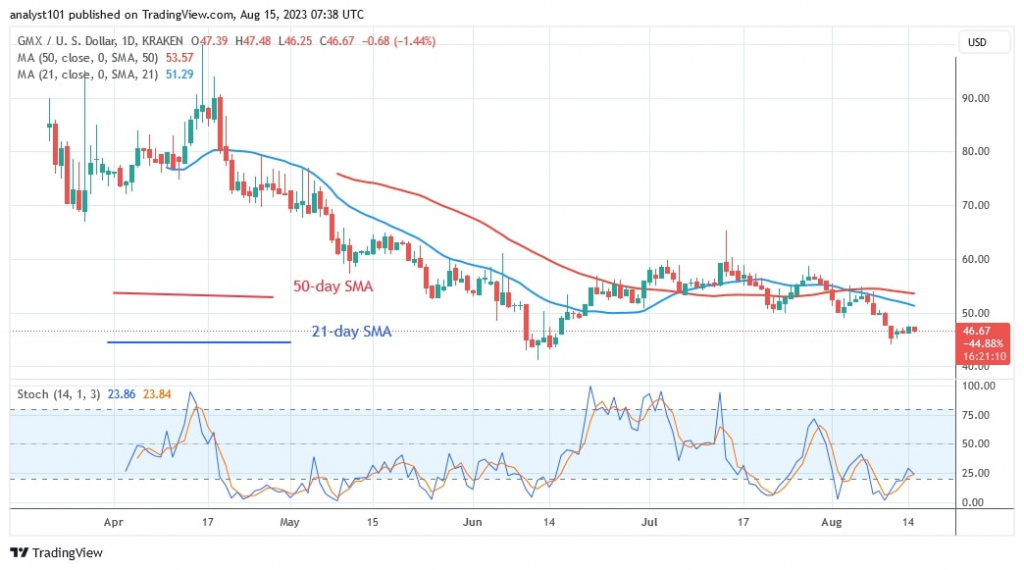
The price of GMX (GMX) is falling below its moving average lines. GMX fell from a high of $90 to a low of $41. The bearish momentum has eased above the $41 support as the cryptocurrency resumed its uptrend. The cryptocurrency price broke above the moving average lines, but the positive momentum did not hold above the $60 high. As the altcoin slipped above the moving average lines, GMX was pushed back to the $60 resistance level three times.
Meanwhile, GMX is rising above the 25 level of the daily stochastic. The market has previously reached the oversold zone. The altcoin is the worst performing cryptocurrency, as the following characteristics show:
Current price: $46.60
Market capitalization: $434,087,574
Trading volume: $14,382,041
7–day loss: 10.85%
Mantle
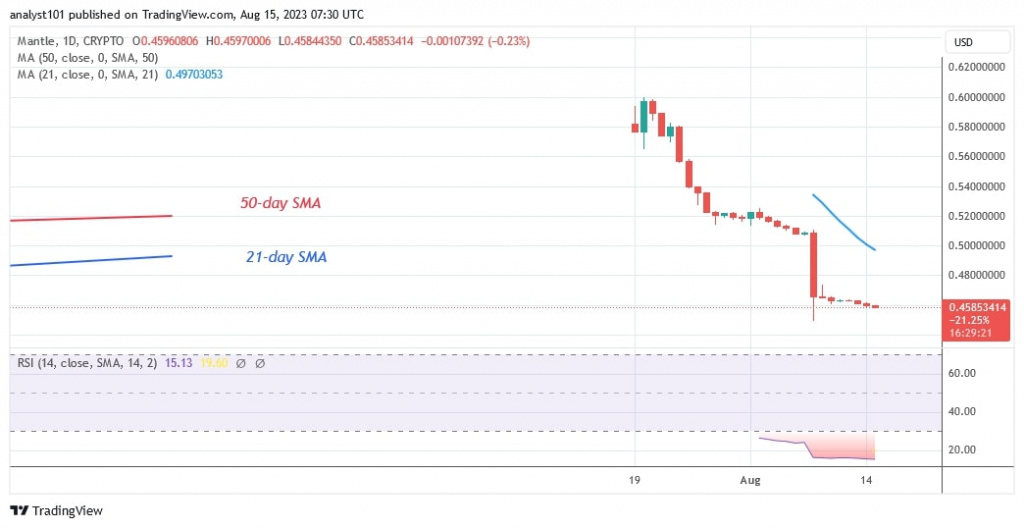
The price of Mantle (MNT) dropped significantly and reached a bearish exhaustion. The cryptocurrency fell to a low of $0.44 and resumed its sideways trend. Doji candlesticks have dominated the sideways trend since August 8, limiting the price movement. At the time of writing, Mantle is trading at $0.45. MNT is now trading in the oversold zone of the market.
The price of the cryptocurrency is below the moving average lines. For the period 14, MNT is at level 15 of the Relative Strength Index l. MNT is the cryptocurrency with the second lowest performance and has the following characteristics:
Current Price: $0.4572
Market capitalization: $2,855,945,540
Trading volume: $6,206,611
7–day loss: 10.32%
Optimism
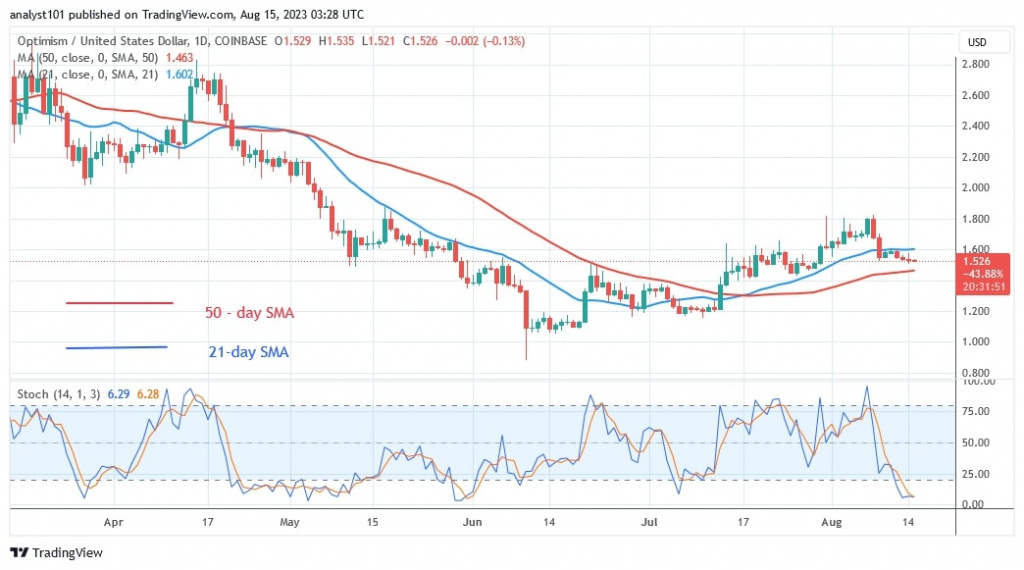
The price of Optimism (OP) is rising after the recent decline. The cryptocurrency broke above the moving average lines but got stuck at the high of $1.80. Buyers were unable to maintain the uptrend above the current high, which led to the decline between the moving average lines. The market was oversold as a result of the downturn. Selling pressure is expected to abate as the price trades between the moving average lines. OP will resume its trend when the moving average line is crossed. OP is below the Stochastic daily value of 20. The market has reached the oversold area. In terms of performance, it is the third worst coin. Below are the characteristics:
Current price: $1.52
Market capitalization: $6,557,753,562
Trading Volume: $92,272,537
7–Day Loss: 9.52%
XDC Network
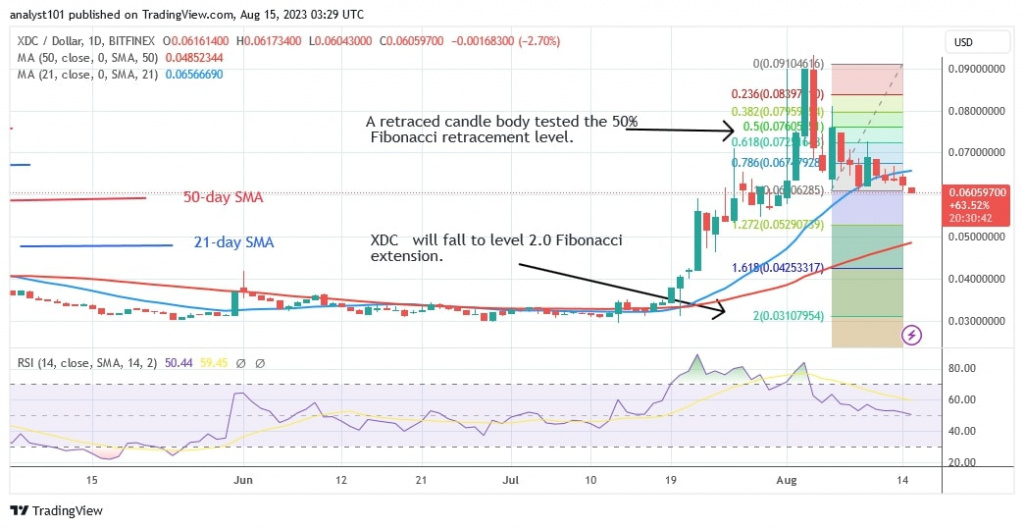
XDC Network (XDC) is now in a downtrend after the recent surge. The high of the recent uptrend was $0.093. At the time of writing, the altcoin had fallen as low as $0.060. The price signal suggests that the altcoin is likely to fall further to its previous low.
Meanwhile, XDC has made an upward correction after the drop on August 6, and a candlestick has tested the 50% Fibonacci retracement level. The correction means that XDC will fall to the Fibonacci extension level of $2.0, or $0.031. The cryptocurrency is now at the Relative Strength Index 50 level for period 14, which means that the altcoin has reached its price equilibrium. That is, demand and supply have reached an equilibrium point. It is the coin with the fourth worst performance. It has the following characteristics:
Current price: $0.06118
Market capitalization: $2,313,972,338
Trading volume: $14,089,081
7–day loss %: 8.53%
Bone ShibaSwap
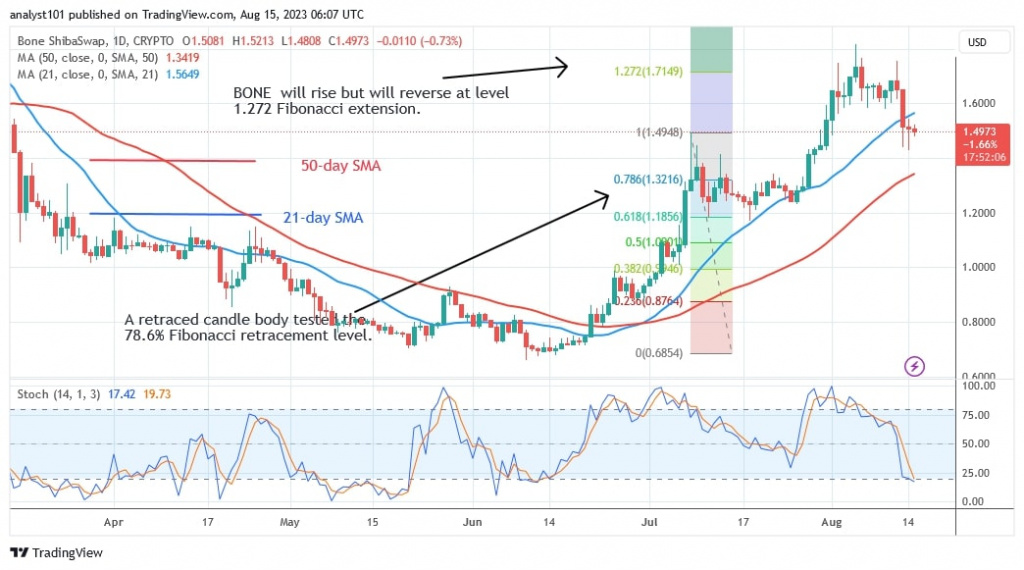
Bone ShibaSwap (BONE) is falling after reaching a high of $1.71. The altcoin is trading below the 21-day simple moving average but above the 50-day simple moving average. The bearish momentum could extend to a low above the 50-day simple moving average. At the time of writing, the market had reached a low of $1.49.
According to the stochastic on the daily chart, the current decline is reaching the oversold zone. The altcoin tends to stall between the moving average lines and BONE will be forced to make another fluctuating move between the moving average lines.
Meanwhile, BONE is in a downtrend below the daily stochastic level of 25. OP is the fifth worst cryptocurrency. It has the following characteristics:
Current price: $1.50
Market capitalization: $375,946,302
Trading volume: $11,682,729
7–day loss: 5.20%
Find out our weekly cryptocurrency market analysis of altcoins showing evidence of a potential breakout from CoinIdol.com.
Disclaimer. This analysis and forecast are the personal opinions of the author and are not a recommendation to buy or sell cryptocurrency and should not be viewed as an endorsement by CoinIdol.com. Readers should do their own research before investing in funds.
- SEO Powered Content & PR Distribution. Get Amplified Today.
- PlatoData.Network Vertical Generative Ai. Empower Yourself. Access Here.
- PlatoAiStream. Web3 Intelligence. Knowledge Amplified. Access Here.
- PlatoESG. Automotive / EVs, Carbon, CleanTech, Energy, Environment, Solar, Waste Management. Access Here.
- PlatoHealth. Biotech and Clinical Trials Intelligence. Access Here.
- ChartPrime. Elevate your Trading Game with ChartPrime. Access Here.
- BlockOffsets. Modernizing Environmental Offset Ownership. Access Here.
- Source: https://coinidol.com/weekly-altcoins-fall-as-sellers-pressure/
- :has
- :is
- :not
- 10
- 11
- 14
- 15%
- 20
- 2023
- 23
- 25
- 49
- 50
- 60
- 8
- 80
- 9
- a
- above
- According
- After
- All
- Altcoin
- Altcoins
- an
- analysis
- and
- Another
- ARE
- AREA
- AS
- At
- Aug
- AUGUST
- author
- average
- back
- BE
- bearish
- Bearish Momentum
- before
- below
- between
- BONE
- breakouts
- Broke
- but
- buy
- buyers
- by
- candlesticks
- capitalization
- characteristics
- Chart
- Coin
- COM
- continue
- could
- Crossed
- cryptocurrency
- cryptocurrency market
- Cryptocurrency Price
- Current
- daily
- Decline
- Demand
- DID
- do
- downtrend
- DOWNTURN
- Drop
- dropped
- Equilibrium
- evidence
- example
- expected
- extend
- extension
- Fall
- Fallen
- Falling
- false
- Fibonacci
- Find
- following
- For
- Forecast
- Fourth
- from
- funds
- further
- GMX
- had
- Have
- High
- Highs
- hold
- HTTPS
- in
- index
- info
- investing
- IT
- ITS
- jpg
- Led
- Level
- likely
- limiting
- Line
- lines
- loss
- Low
- lowest
- made
- maintain
- make
- Market
- Market Analysis
- Market Capitalization
- means
- Meanwhile
- Momentum
- move
- movement
- moving
- moving average
- network
- now
- of
- on
- OP
- Opinions
- Optimism
- Optimism (OP)
- or
- out
- own
- performance
- performing
- period
- personal
- plato
- Plato Data Intelligence
- PlatoData
- Point
- positive
- potential
- pressure
- previous
- previously
- price
- Price Analysis
- pushed
- reached
- reaching
- readers
- recent
- Recommendation
- relative
- relative strength index
- renewed
- research
- Resistance
- result
- resume
- retracement
- rising
- Second
- sell
- Sellers
- Selling
- should
- show
- sideways
- Signal
- significantly
- Simple
- since
- strength
- Suggests
- supply
- support
- surge
- tends
- terms
- tested
- that
- The
- their
- they
- Third
- this
- three
- time
- times
- to
- trades
- Trading
- trading volume
- Trend
- unable
- under
- uptrend
- upward
- value
- volume
- was
- weekly
- were
- when
- which
- will
- with
- Worst
- writing
- XDC
- XDC Network
- zephyrnet


