Coinidol.com bringing weekly cryptocurrency price analysis. Top altcoins that all rose above their moving average lines and recovered from their respective supports.
The price of cryptocurrencies has risen to the point where the market is overbought. Cryptocurrencies are struggling to break through their existing barriers. Let us take a closer look at a handful of these cryptocurrencies.
Waves
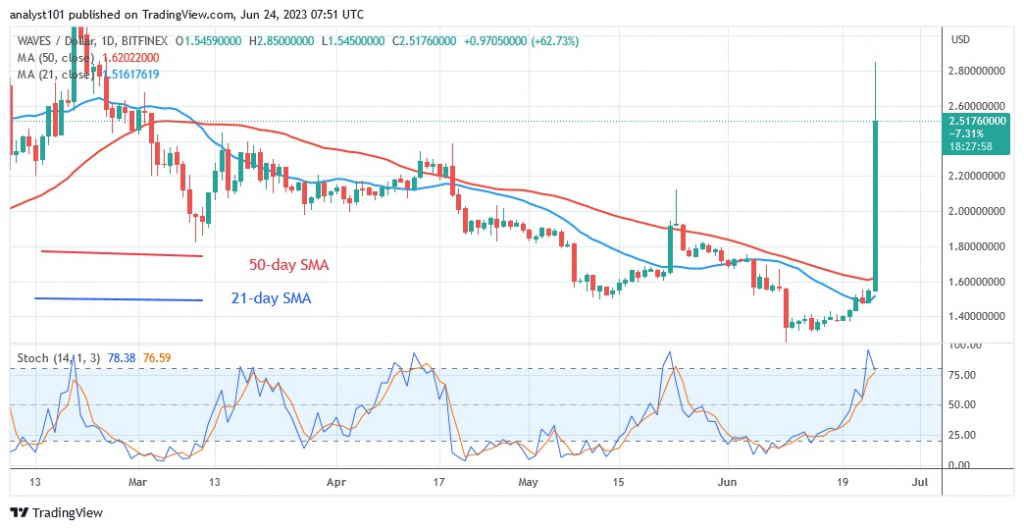
The price of Waves (WAVES) is rising as it climbs above the moving average lines. WAVES was in a bearish trend in the last price action. The cryptocurrency value dropped drastically to its historical price on December 30, 2022.
Similarly, WAVES/USD fell to a low of $1.23 as bulls bought the dips. The rising bullish momentum broke above the moving average lines and returned to the previous high. The altcoin reached a high of $2.85. At the time of writing, the cryptocurrency asset is trading at $2.33. The altcoin has moved into the overbought territory. WAVES has retraced to the breakout level of $2.38. If the current support holds, the uptrend will resume. The price is in a bearish momentum below the daily stochastic level of 80. WAVES is the top cryptocurrency this week and has the following characteristics:
Current price: $2.34
Market capitalization: $289,697,705
Trading volume: $2B
7-day gain/loss: 91.46%
Bitcoin Cash
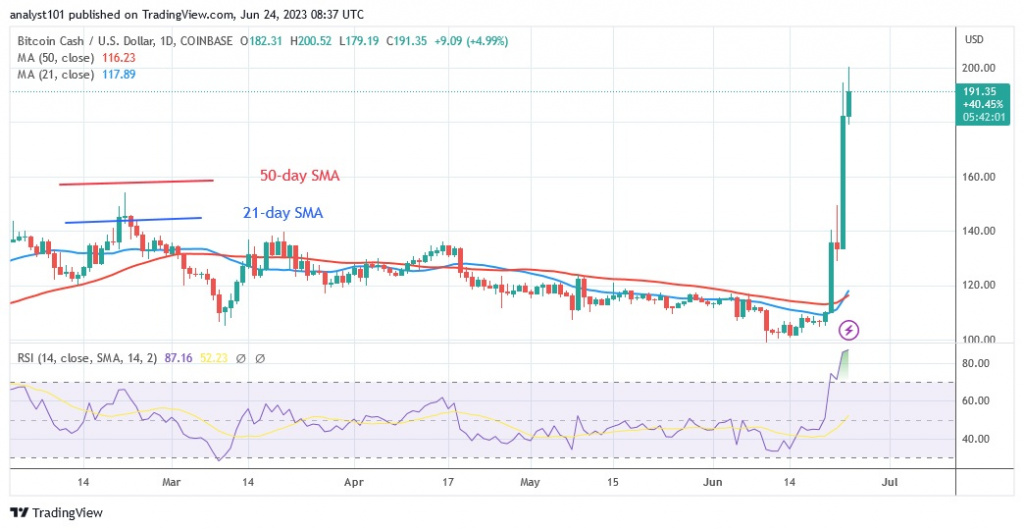
The price of Bitcoin Cash (BCH) is rising as it recovers. After the price decline on June 16, the cryptocurrency asset is in a sideways pattern. On June 10, bulls bought the dips as the altcoin fell below the support level of $100. BCH then recovered and broke above the moving average lines. The altcoin reached a high of $200.25. The positive momentum now continues below the recent high. At the time of writing, BCH has retraced to a low of $191.13. As the market is overbought, further upside in the altcoin is unlikely. For the period 14, BCH has a Relative Strength Index of 87. It is the second best performing cryptocurrency and has the following characteristics:
Current price: $190.90
Market capitalization: $3,950,230,127
Trading volume: $1B
7-day gain/loss: 76.04%
Pepe
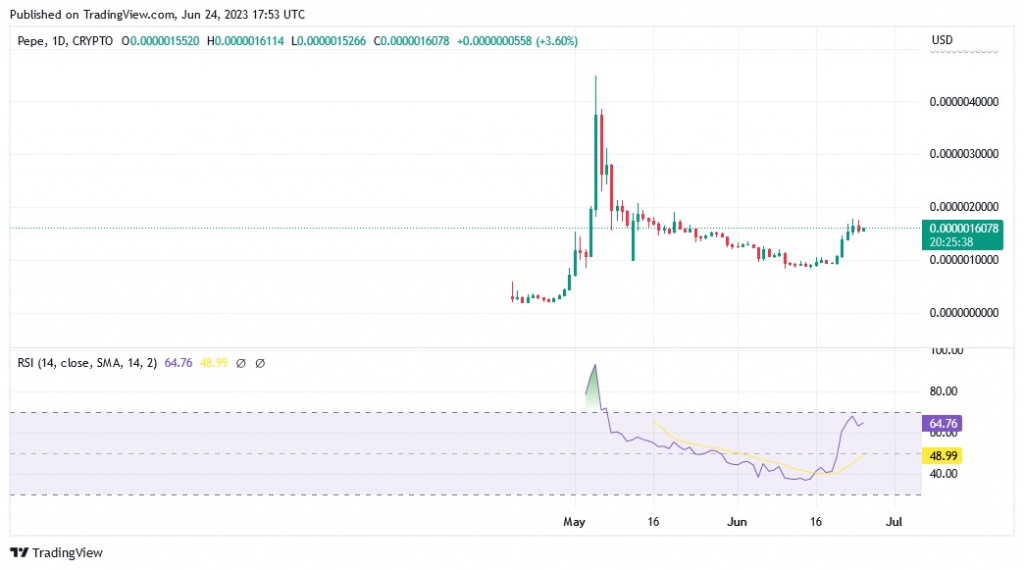
The price of Pepe (PEPE) has broken out above the moving average lines. The altcoin has been in a downtrend since May 6. Previously, the cryptocurrency asset was locked in a price range from $0.0000010000 to $0.0000012000. The price recently broke out above the moving average lines. The current high has rejected the upward movement. The uptrend is currently broken as the price fluctuates above the moving average line. If the altcoin stays above the moving average lines, the uptrend will resume. In the meantime, the altcoin is at a Relative Strength Index level of 65 for period 14, indicating that the altcoin has the potential for further growth. It is the third best-performing cryptocurrency and has the following characteristics:
Current price: $0.000001568
Market capitalization: $656,742,215
Trading volume: $410M
7-day gain/loss: 50.37%
Bitcoin SV
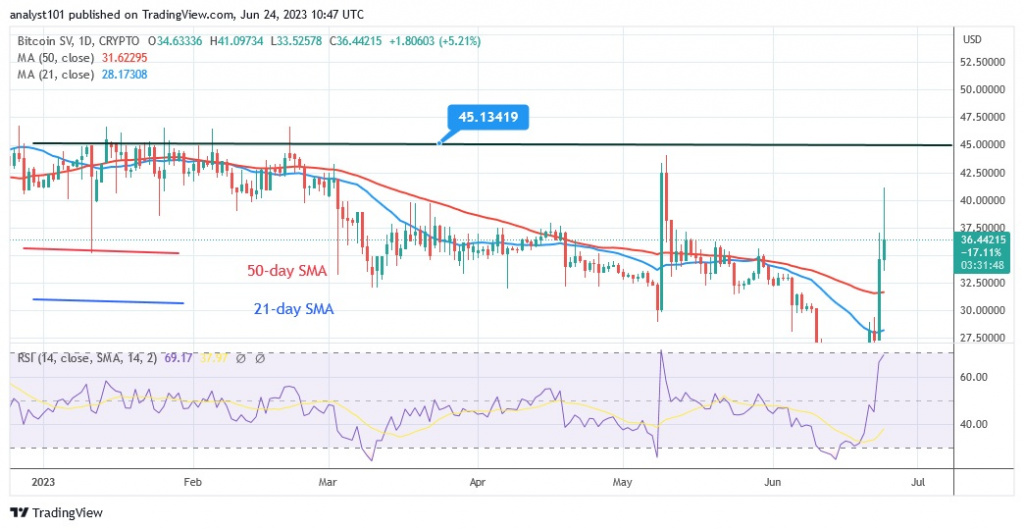
Bitcoin SV (BSV) is trading sideways, below the overhead resistance. The cryptocurrency value fell to a low of $25 before recovering. By reaching the $45 overhead resistance, the bullish momentum is extended. Since December 12, 2022, the aforementioned resistance has not been broken. At the time of writing, the altcoin is worth $36. The altcoin is in an uptrend with a Relative Strength Index of 68 for the period of 14. BSV is the fourth most valuable cryptocurrency. Some of the characteristics are as follows:
Current price: $36.39
Market capitalization: $764,123,445
Trading volume: $303M
7-day gain/loss: 50.07%
Kava
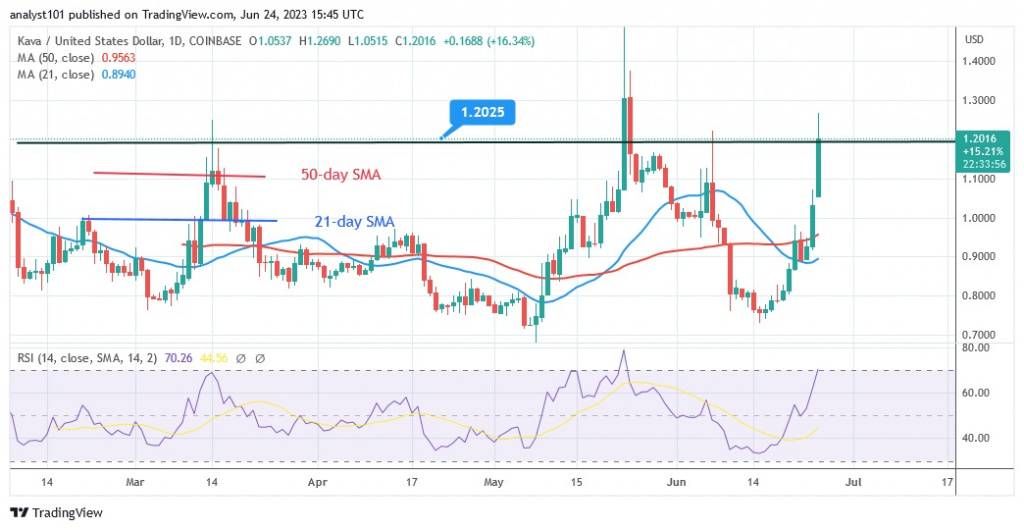
Kava (KAVA) is in a sideways trend, but is in an uptrend. Positive momentum has increased and the price has retested the overriding resistance at $1.20. The current rally is reversing after retesting the $1.20 level. The altcoin reached a high of $1.26 before falling back above the $1.20 support level. The overriding resistance of $1.20 has not been breached since January 20. At the time of writing, the altcoin is worth $1.18. The cryptocurrency has reached the overbought zone of the market. It is unlikely that the cryptocurrency will continue to rise. For the period 14, the Relative Strength Index is 70. It is the fifth best performing cryptocurrency and has the following characteristics:
Current price: $1.19
Market capitalization: $696,787,526
Trading volume: $279M
7-day gain/loss: 31.65%
Disclaimer. This analysis and forecast are the personal opinions of the author and are not a recommendation to buy or sell cryptocurrency and should not be viewed as an endorsement by CoinIdol. Readers should do their own research before investing in funds.
- SEO Powered Content & PR Distribution. Get Amplified Today.
- PlatoData.Network Vertical Generative Ai. Empower Yourself. Access Here.
- PlatoAiStream. Web3 Intelligence. Knowledge Amplified. Access Here.
- PlatoESG. Automotive / EVs, Carbon, CleanTech, Energy, Environment, Solar, Waste Management. Access Here.
- BlockOffsets. Modernizing Environmental Offset Ownership. Access Here.
- Source: https://coinidol.com/altcoins-existing-barriers/
- :has
- :is
- :not
- :where
- $3
- 10
- 10:25
- 12
- 13
- 14
- 16
- 19
- 20
- 2022
- 2023
- 23
- 24
- 25
- 26%
- 30
- 31
- 39
- 50
- 70
- 80
- 87
- 91
- a
- above
- Action
- After
- All
- Altcoin
- Altcoins
- an
- analysis
- and
- ARE
- AS
- asset
- At
- author
- average
- back
- barriers
- BCH
- BE
- bearish
- Bearish Momentum
- been
- before
- below
- BEST
- Bitcoin
- Bitcoin Cash
- Bitcoin Cash (BCH)
- Bitcoin SV
- Bitcoin SV (BSV)
- bought
- Break
- breakout
- Bringing
- Broke
- Broken
- BSV
- Bullish
- Bulls
- but
- buy
- by
- capitalization
- Cash
- characteristics
- Chart
- closer
- COM
- continue
- continues
- cryptocurrencies
- cryptocurrency
- cryptocurrency market
- Cryptocurrency Price
- Current
- Currently
- daily
- December
- Decline
- do
- downtrend
- drastically
- dropped
- existing
- Falling
- fluctuates
- following
- follows
- For
- Forecast
- Fourth
- from
- funds
- further
- Growth
- handful
- High
- historical
- holds
- HTTPS
- if
- in
- increased
- index
- info
- into
- investing
- IT
- ITS
- January
- jpg
- june
- KAVA
- Last
- let
- Level
- Line
- lines
- locked
- Look
- Low
- Market
- Market Analysis
- May..
- meantime
- Momentum
- most
- moved
- movement
- moving
- moving average
- now
- of
- on
- Opinions
- or
- out
- overriding
- own
- Pattern
- pepe
- performing
- period
- personal
- plato
- Plato Data Intelligence
- PlatoData
- Point
- positive
- potential
- previous
- previously
- price
- PRICE ACTION
- Price Analysis
- rally
- range
- reached
- reaching
- readers
- recent
- recently
- Recommendation
- Recover
- recovering
- Recovers
- relative
- relative strength index
- research
- Resistance
- respective
- resume
- Rise
- Risen
- rising
- ROSE
- Second
- sell
- should
- sideways
- Similarly
- since
- some
- strength
- Struggle
- Struggling
- support
- support level
- Supports
- Take
- territory
- that
- The
- their
- then
- These
- Third
- this
- this week
- Through
- time
- to
- top
- Trading
- Trend
- unlikely
- Upside
- uptrend
- upward
- us
- Valuable
- value
- volume
- was
- waves
- Waves (WAVES)
- week
- weekly
- will
- with
- worth
- writing
- zephyrnet


