Weekly cryptocurrency analysis of Astar, Render, SafePal, KuCoin, Token and Stellar brought to you by Coinidol.com.
This week, altcoin prices appear to be diverging. The extended range bound movement is causing several altcoins to lose even more value.
Astar
The price of Astar (ASTR) is rising above the moving average lines. The price of the cryptocurrency is creating a series of higher highs and higher lows. The given price predicted that the coin would continue to rise. A retraced candle body has tested the 38.2% Fibonacci retracement line of the July 23 upswing. The retracement suggests that ASTR will rise to the 2.618 Fibonacci extension or $0.084. Currently, the altcoin has reached a high of $0.059. However, the positive momentum is expected to be broken when the market approaches the overbought zone. Currently, the altcoin is between the moving average lines, which indicates that the cryptocurrency is likely to move within a certain range. It is above the daily stochastic value of 80. It is the most successful cryptocurrency and has the following characteristics:

Current price: $0.06081
Market capitalization: $481,485,090
Trading volume: $17,688,274
7–day gain/loss: $9.71
Render
Render (RNDR) is falling, but negative momentum has slowed as it is trapped between moving average lines. The 50-day line SMA has slowed down the cryptocurrency’s upward movement. The altcoin is currently trading above the 21-day simple moving average but below the 50-day simple moving average. When the moving average lines are broken, the altcoin will develop a trend. For example, on July 23, Altcoin corrected upward and a candlestick tested the 61.8% Fibonacci retracement line. The correction predicts that the altcoin will continue to fall to the Fibonacci extension of $1.618 and $1.06, respectively. For the period 14, RNDR is trading with a strong trend above the Relative Strength Index level 52. Render is the second most valuable cryptocurrency and has the following characteristics:

Current price: is $1.49
Market capitalization: 801,620,824
Trading volume: $34,348,476
7–day gain/loss: 9.26%
SafePal
SafePal (SFP) has regained positive momentum after breaking above its moving average lines. On September 9, the altcoin rose to a high of $0.68 before falling back. The positive momentum was halted in the last three days as the altcoin retreated above the moving average lines. The current high represents an overbought market zone. If the altcoin stays above the moving average lines, the uptrend will resume and retest the overbought region. If the price falls below the moving average lines, the decline will resume. SafePal is in a negative trend below the daily stochastic threshold of 60. It is the coin with the third highest profit margin. Below are some of the characteristics:

Current price: $0.5766
Market capitalization: $288,301,902
Trading volume: $13,894,750
7–day gain/loss: 5.21%
KuCoin Token
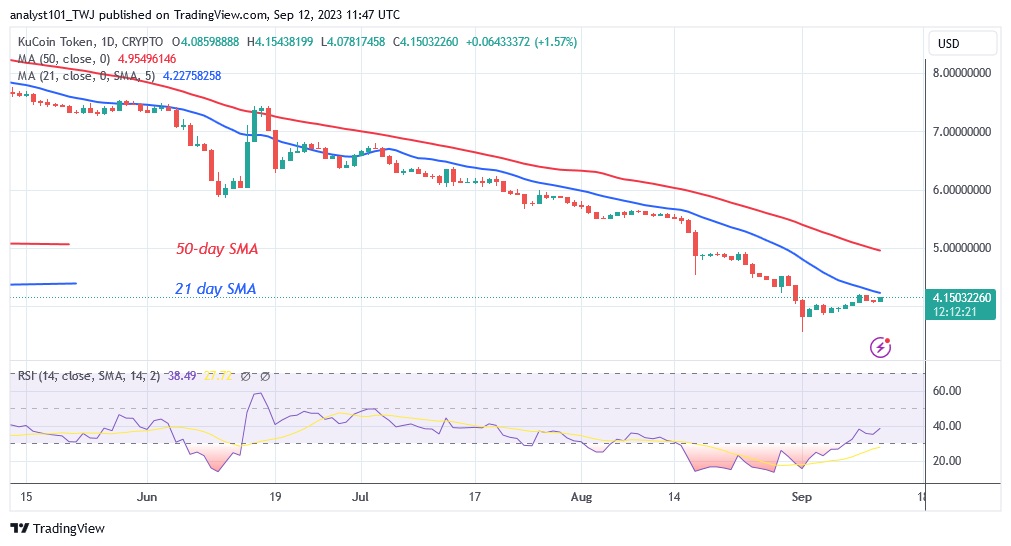
KuCoin Token (KCS) is declining and has fallen significantly to the bottom of the chart. On September 1, the cryptocurrency fell to a low of $3.54, but the bulls bought the dips. The upward correction is rejected by the 21-day simple moving average. However, if the cryptocurrency price rises above the 21-day simple moving average, the positive momentum will extend to the 50-day simple moving average. The price of KCS will resume its uptrend once it crosses the moving average lines. However, if the price is rejected at the moving average lines, selling pressure will resume. The altcoin is correcting upwards after crossing the Relative Strength Index value 38 for the period 14. KCS is the fourth most valuable cryptocurrency and has the following characteristics:

Current price: $4.15
Market capitalization: $705,375,966
Trading volume: $804,056
7–day gain/loss: 5.15%
Stellar
Stellar (XLM) has been moving sideways since July 13. The bulls’ inability to break through the resistance at $0.16 led to this sideways movement. The crypto asset was knocked back three times at the overhead resistance as it fell below the moving average lines. The altcoin is currently trading at $0.13 but is stuck between the moving average lines. The upside move was met with resistance by the 50-day line SMA, leaving it trapped between the moving average lines. Meanwhile, the altcoin has reached the overbought area of the daily stochastic at level 80. It is the fifth best performing cryptocurrency and has the following characteristics:

Current price: $0.1317
Market capitalization: $6,536,020,731
Trading volume: $129,044,341
7–day gain/loss: 4.74
Disclaimer. This analysis and forecast are the personal opinions of the author and are not a recommendation to buy or sell cryptocurrency and should not be viewed as an endorsement by CoinIdol.com. Readers should do their research before investing in funds.
- SEO Powered Content & PR Distribution. Get Amplified Today.
- PlatoData.Network Vertical Generative Ai. Empower Yourself. Access Here.
- PlatoAiStream. Web3 Intelligence. Knowledge Amplified. Access Here.
- PlatoESG. Automotive / EVs, Carbon, CleanTech, Energy, Environment, Solar, Waste Management. Access Here.
- PlatoHealth. Biotech and Clinical Trials Intelligence. Access Here.
- ChartPrime. Elevate your Trading Game with ChartPrime. Access Here.
- BlockOffsets. Modernizing Environmental Offset Ownership. Access Here.
- Source: https://coinidol.com/altcoins-downward-pressure/
- :has
- :is
- :not
- $3
- 06
- 08
- 1
- 12
- 13
- 14
- 15%
- 16
- 2%
- 2023
- 23
- 26%
- 49
- 54
- 60
- 80
- 9
- a
- above
- After
- Altcoin
- Altcoins
- an
- analysis
- and
- appear
- approaches
- ARE
- AREA
- AS
- asset
- Astar
- At
- author
- average
- back
- BE
- been
- before
- below
- BEST
- between
- body
- Bottom
- bought
- Bound
- Break
- Breaking
- Broken
- brought
- Bulls
- but
- buy
- by
- capitalization
- causing
- certain
- characteristics
- Chart
- Coin
- COM
- continue
- corrected
- Creating
- crypto
- crypto asset
- cryptocurrency
- cryptocurrency market
- Cryptocurrency Price
- Current
- Currently
- daily
- Days
- Decline
- Declining
- develop
- do
- down
- downward
- Even
- example
- expected
- extend
- extension
- Fall
- Fallen
- Falling
- Falls
- Fibonacci
- following
- For
- Forecast
- Fourth
- funds
- given
- High
- higher
- highest
- Highs
- However
- HTTPS
- if
- in
- inability
- index
- indicates
- info
- investing
- IT
- ITS
- jpg
- July
- July 23
- KCS
- Kucoin
- Kucoin Token
- Last
- leaving
- Led
- Level
- likely
- Line
- lines
- lose
- Low
- Lows
- Margin
- Market
- Market Analysis
- Meanwhile
- met
- Momentum
- more
- most
- move
- movement
- moving
- moving average
- negative
- of
- on
- once
- Opinions
- or
- performing
- period
- personal
- plato
- Plato Data Intelligence
- PlatoData
- positive
- predicted
- Predicts
- pressure
- price
- Prices
- Profit
- range
- reached
- readers
- Recommendation
- region
- Rejected..
- relative
- relative strength index
- represents
- research
- Resistance
- respectively
- resume
- retracement
- Rise
- Rises
- rising
- ROSE
- s
- SafePal
- Second
- sell
- Selling
- sept
- September
- Series
- several
- should
- sideways
- significantly
- Simple
- since
- SMA
- some
- Stellar
- Stellar (XLM)
- strength
- strong
- successful
- Suggests
- tested
- that
- The
- their
- Third
- this
- this week
- three
- threshold
- Through
- times
- to
- token
- trade
- Trading
- Trend
- under
- Upside
- uptrend
- upward
- upwards
- Valuable
- value
- volume
- was
- week
- weekly
- when
- which
- will
- with
- within
- would
- XLM
- You
- zephyrnet


