The past few days have been filled with an unprecedented event leading up to the CEO of Binance, Changpeng Zhao, stepping down from its role to the United States (US) Department of Justice (DOJ) sanctioning one of the biggest crypto exchanges, Binance, with a fine of $4.3 billion.
This news shocked many cryptocurrency traders and investors as many feared what could happen to the cryptocurrency market and the price of Bitcoin, which could influence the general behavior’s of the market.
The news surrounding Binance and its CEO Changpeng Zhao, also known as CZ, has been accepted with mixed feelings as the cryptocurrency market was expected to react negatively. Still, the market has continued to hold its ground despite the shock.
The reaction, as seen by the cryptocurrency market, its communities, traders, and investors, have been applauded. Many great analysts speculate this is a bullish sign for the cryptocurrency industry as the price of assets prepares for Bitcoin’s halving and a potential bull run.
– Advertisement –
Other sources and analyst believes that sanctions placed on Changpeng Zhao (CZ) and Binance are to pave the way for better cryptocurrency compliance to regulations as Bitcoin spot ETF (Exchange-traded fund) is more than 95% approved as Blackrock applications in the past have never been turned down.
The uncertainties in the crypto market have had a less negative effect in terms of price action on the cryptocurrency market as many weekly top 5 cryptos (XRP, UNFI, BNB, SOL, SHIB) continue to look strong and could be gearing for more opportunities for traders to open a long position or place new buy orders for better price gain.
On-chain analysis shows the cryptocurrency market continues to hold strong as it awaits major development in the coming days and weeks as the volume could pick for many assets, including the number one cryptocurrency by market capitalization, Bitcoin.
Despite the uncertainties surrounding events in the market, Bitcoin has shown much dominance, holding up well as it paves the way for many altcoins to rally higher, producing double-digit gains.
The cryptocurrency market heat map from Coin360.com has shown the price of Bitcoin, Ethereum, Binance Coin, and other weekly top 5 cryptos (XRP, UNFI, BNB, SOL, SHIB) seeing a red price zone as a result of low volume following Thanksgiving day and weekend following its as price could pick better in the coming days.
The price of Bitcoin, Ethereum, and other altcoins saw a price decline of not less than 5%, suggesting the cryptocurrency market continues to hold pretty well considering how negative news impact could have affected the market as Changpeng Zhao (CZ) and Binance have had much influence in the market.
The price action for Bitcoin in the past few days has demonstrated much bullish price action for the great assets as bulls continue to dominate price since its rally from a yearly low of $15,500 as price faces a key area of resistance of $38,000 to rally high to a region of $40,000 to $42,000.
The negative news of Binance and its CEO Changpeng Zhao (CZ) saw the price of Bitcoin drop to $36,500 as it looked like it would drop lower to $32,000. Still, bulls took control of the price, rallying it to $38,400 for the first time this year as Bitcoin created a new yearly high.
New yearly highs for Bitcoin despite uncertainties highlight many bullish price actions for Bitcoin as the price of Bitcoin (BTC) needs to break and close above $38,000 on the higher timeframe to trend higher to a region of $40,000 to $42,000 acting as supply zone for past prices.
The price of Bitcoin on the daily chart has continued to range close to its key resistance of $38,000 as a break and close above this region could trigger more bullish price action towards $40,000, and higher prices could be activated in the coming days and weeks.
Despite the price range for Bitcoin, the price of Ethereum has struggled to close above $2,100 after a long time of price ranging below the key region of $2,000. The price looks strong above $2,000 as a close above the region of $2,150 for Ethereum price would mean bullish for Ethereum’s (ETH) price.
If the price of Ethereum closes above $2,150, we could see the price of Ethereum test new yearly highs of $2,300 to $2,400 as the price of Ethereum pumping to such highs could lead to better price action for other altcoins and weekly top 5 cryptos (XRP, UNFI, BNB, SOL, SHIB) as much attention would be on the price movements.
The prices of Bitcoin and Ethereum continue to look strong above their daily 50-day and 200-day Exponential Moving Averages (50-day and 200-day EMAs) as the price maintains their bullish price run, which is good for the market as the trend remains intact.
Let us focus on how these altcoins would perform in the coming weeks, as much volume would be expected in the coming days for the cryptocurrency market to have a breather away from its uncertainties.
Ripple (XRP) Price Analysis on the Daily Chart as Weekly Top 5 Crypto
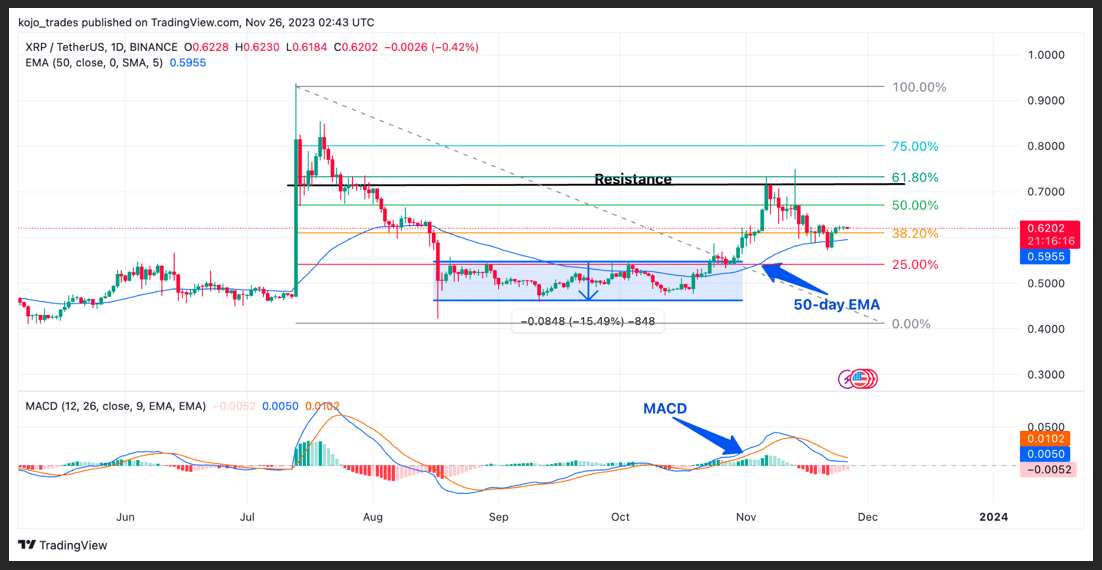

Ripple (XRP) remains one of the most bullish assets in the current crypto bullish price recovery as on-chain activities for Ripple (XRP) continue to soar high as the great cryptocurrency is tipped to solve payment issues across the globe as it has been built with such potential.
The holders of Ripple (XRP) continue accumulating as the price of XRP/USDT faces many struggles to break past the region of $0.65, acting as resistance for the price of Ripple (XRP) despite increased accumulation for this asset rises.
Despite the market looking increasingly bullish for many altcoins, Ripple’s army has yet to see smiles on their faces as the price of XRP/USDT fails to compensate for increased activity on Ripple’s network.
Could Ripple’s (XRP) struggle be accredited to paper hands selling off their assets, or do whales need more XRP accumulation to push the price of XRP/USDT higher from its current price range?
With many questions raised over the price of XRP/USDT, it is still believed that this great crypto asset could be one of the major runners in the next crypto bull market as analysts speculate triple price digits for this asset.
The price of XRP/USDT on the daily timeframe continues its range price movement for over a month after seeing its price rejected at around $0.73 as the price broke out of its range to trend higher.
The price of XRP/USDT, despite suffering price rejection from bears, has remained strong above its 50-day EMA and 38.2% Fibonacci Retracement value, which continues to support the price of XRP/USDT on the daily timeframe.
The Moving Average Convergence Divergence (MACD) and Relative Strength Index (RSI) for XRP on the daily timeframe suggest the price of XRP/USDT looks bearish as the price would need more buy volume to push price from its current price range.
Major XRP/USDT support zone – $0.6
Major XRP/USDT resistance zone – $0.75
MACD trend – Bearish
Illuvium (ILV) Price Chart Analysis on the Daily Timeframe
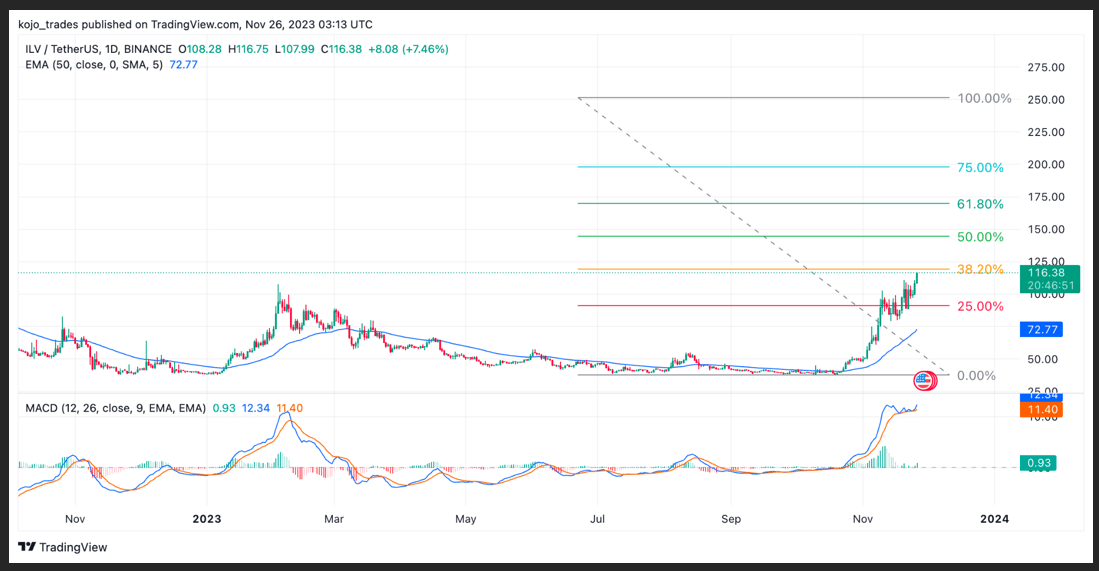

Illuvium (ILV) remains one of the most significant crypto assets in the world of gaming as the price of this asset remains undervalued at this current price range, considering how high the price of ILV/USDT has gone in the past bull market.
Gaming remains a huge part of the cryptocurrency market. It would continue to do well after its breakthrough in the last bull market, where the likes of SAND and ILV made over 50 times its value, with many traders and investors jumping into the hype.
The crypto bear market has affected the price of many gaming tokens, with ILV not left in the shadows as the price suffered over 90% drop from its all-time high of over $2,000, suggesting this token could be one of the greatest steals when the gaming hype resurfaces.
After its drop from over $2,000 to a low of $30, the price of ILV/USDT formed good support around this region as the price of ILV/USDT ranged to build more momentum for its bullish price run.
With the market looking good for many assets, the price of ILV/USDT broke above its range of $100. The price looks set to rally to a high of $400 as it currently trades above its 50-day EMA.
The price of ILV/USDT needs to break above 38.2% FIB value to spark more bullish price action above $120 as the price would attract more traders and investors looking to hop on this trade.
The price of ILV/USDT on the MACD and RSI remains bullish on lower and higher timeframes.
Major ILV/USDT support zone – $88
Major ILV/USDT resistance zone – $120
MACD trend – Bullish
Binance Coin (BNB) Price Analysis on the Daily Timeframe
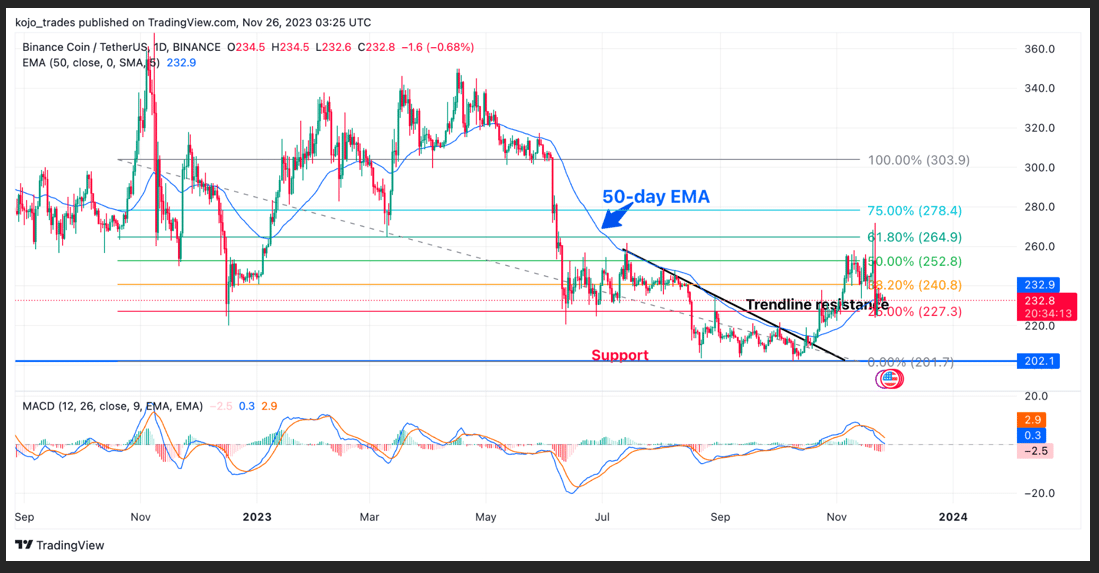

The price of Binance Coin (BNB) saw a price slash of over 10% following the news of the resignation of Binance CEO Changpeng Zhao (CZ) and the acceptance to pay a fine of $4.3 Billion as a sanction from the US DOJ as this news hurt the token.
Binance coin (BNB) has had a major hit for FUD (fear, uncertainty, and doubt) in the past two years of a bearish run after the collapse of FTX as many tipped Binance and its token BNB to drop to as low as $10.
Despite many FUDs and the current sanction on Binance, its native token, BNB has demonstrated strength, holding off sell orders as the price defends the $220 region, acting as strong support for bulls.
The price of BNB/USDT saw its price rejected from a high of $270 as the price dropped to a region of $230, where it continues to hold above its 50-day EMA, acting as support for bulls. The price of BNB/USDT needs to hold above this region to avoid its price retesting at $200 and lower.
The 25% FIB Value region keeps BNB bears from taking control of the market, as its daily MACD and RSI indicate bearish price action for BNB/USDT.
Major BNB/USDT support zone – $220
Major BNB/USDT resistance zone – $240
MACD trend – Bearish
Solana (SOL) Price Analysis as a Weekly Top 5 Crypto
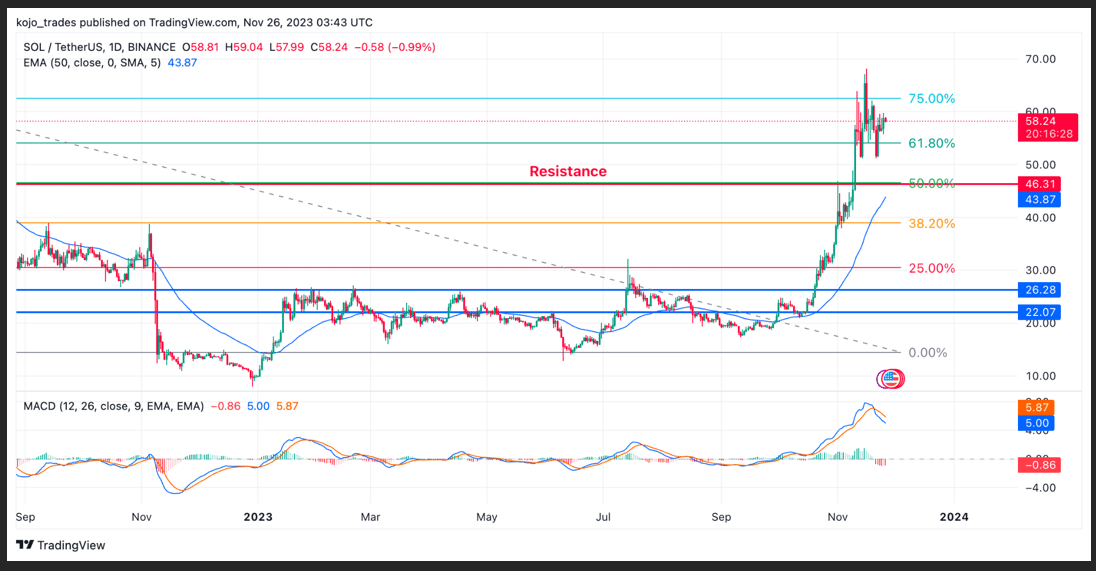

Solana (SOL) remains one of the top performers of 2023 as this token has outperformed the likes of Bitcoin and Ethereum by far, rallying from its low of $8 to a high of $62 as many believe the coming bull market would be extraordinary for the likes of SOL.
After its great run to a yearly high of $62, a price rally many traders and investors never saw coming for this year, as many were wowed by the price action demonstrated by SOL/USDT after breaking above its resistance of $32.
The break and close above $32 for SOL/USDT was the green light for bullish price action as the price rallied to $62, signifying that SOL remains one of the crypto assets every trader and investor would want to accumulate.
The price of SOL/USDT currently faces resistance at a region of $62 as price struggles to trend higher with more probability of price dropping to a low of $45, which corresponds to 50% FIB value just above its 50-day EMA, which is a good retracement for many traders and investors.
The region of $45 remains a good buy opportunity for traders and investors who have yet to have the opportunity to load their SOL bags, as the price could trend higher as we head into the bull market with its MACD and RSI remaining bullish.
Major SOL/USDT support zone – $45
Major SOL/USDT resistance zone – $62
MACD trend – Bullish
Shiba Inu (SHIB) Price Analysis on the Daily Timeframe
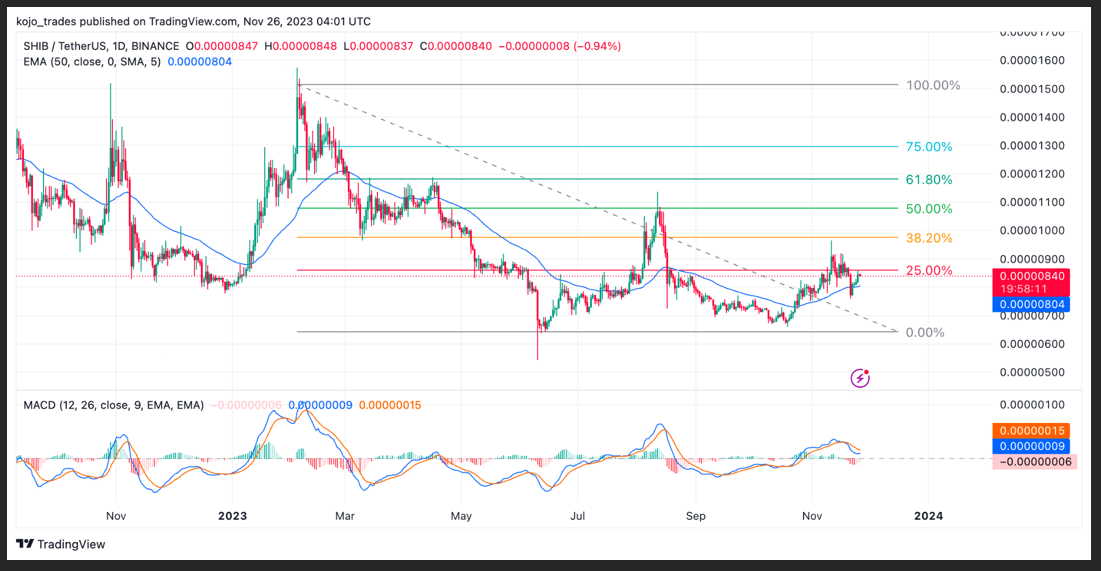

Shiba Inu’s (SHIB) rally above its current price action and range has become a cause for worry for many traders and investors as memecoins like DOGE struggle to show bullish price action above their current price level.
Despite building Shibarium and many community faithful, the price of SHIB/USDT has struggled to reclaim its price above $0.00001, a key region of interest for many traders and investors looking to open a long position.
The price of SHIB/USDT has remained in a price range below its 25% FIB value as the price trades just a little bit above its 50-day EMA as mixed feelings of bear dominance have accompanied such price action.
For better bullish price action, the price of SHIB/USDT needs to reclaim its price above $0.00001, which corresponds to 38.2% FIB value, to restore a bullish price rally as the current price action for SHIB indicates bearishness with its daily MACD.
Major SHIB/USDT support zone – $0.0000075
Major SHIB/USDT resistance zone – $0.0000100
MACD trend – Bearish
Follow Us on Twitter and Facebook.
Disclaimer: This content is informational and should not be considered financial advice. The views expressed in this article may include the author’s personal opinions and do not reflect The Crypto Basic’s opinion. Readers are encouraged to do thorough research before making any investment decisions. The Crypto Basic is not responsible for any financial losses.
-Advertisement-
- SEO Powered Content & PR Distribution. Get Amplified Today.
- PlatoData.Network Vertical Generative Ai. Empower Yourself. Access Here.
- PlatoAiStream. Web3 Intelligence. Knowledge Amplified. Access Here.
- PlatoESG. Carbon, CleanTech, Energy, Environment, Solar, Waste Management. Access Here.
- PlatoHealth. Biotech and Clinical Trials Intelligence. Access Here.
- Source: https://thecryptobasic.com/2023/11/26/weekly-top-5-cryptos-to-watch-xrp-ilv-bnb-sol-shib/?utm_source=rss&utm_medium=rss&utm_campaign=weekly-top-5-cryptos-to-watch-xrp-ilv-bnb-sol-shib
- :has
- :is
- :not
- :where
- $UP
- 000
- 100
- 11
- 150
- 2%
- 2023
- 400
- 50
- 500
- 7
- 95%
- a
- above
- acceptance
- accepted
- accompanied
- accredited
- Accumulate
- accumulation
- across
- acting
- Action
- actions
- activities
- activity
- Advertisement
- advice
- affected
- After
- also
- Altcoins
- an
- analysis
- analyst
- Analysts
- and
- any
- applications
- approved
- ARE
- AREA
- Army
- around
- article
- AS
- asset
- Assets
- At
- attention
- attract
- author
- average
- avoid
- away
- bags
- basic
- BE
- Bear
- Bear Market
- bearish
- Bears
- become
- been
- before
- believe
- believed
- believes
- below
- Better
- Biggest
- Billion
- binance
- Binance CEO
- binance ceo changpeng zhao
- Binance Coin
- Binance Coin (BNB)
- Bit
- Bitcoin
- bitcoin and ethereum
- Bitcoin Drop
- Bitcoin spot etf
- BlackRock
- bnb
- Break
- Breaking
- breakthrough
- Broke
- BTC
- build
- Building
- built
- bull
- Bull Market
- Bull Run
- Bullish
- Bulls
- buy
- by
- capitalization
- Cause
- ceo
- Changpeng
- Changpeng Zhao
- Changpeng Zhao (CZ)
- Chart
- Close
- Closes
- Coin
- Collapse
- COM
- coming
- coming weeks
- Communities
- community
- compliance
- considered
- considering
- content
- continue
- continued
- continues
- control
- Convergence
- corresponds
- could
- created
- crypto
- crypto asset
- Crypto bear market
- crypto bull market
- Crypto Exchanges
- Crypto Market
- crypto-assets
- cryptocurrency
- Cryptocurrency Industry
- cryptocurrency market
- cryptos
- Current
- Currently
- CZ
- daily
- data
- day
- Days
- decisions
- Decline
- demonstrated
- Department
- department of justice
- Department of Justice (DoJ)
- Despite
- Development
- digits
- Divergence
- do
- Doge
- DoJ
- Dominance
- Dominate
- doubt
- down
- Drop
- dropped
- Dropping
- effect
- EMA
- encouraged
- ETF
- ETH
- ethereum
- Ethereum Price
- Ethereum's
- Event
- events
- Every
- exchange-traded
- Exchanges
- expected
- exponential
- expressed
- extraordinary
- faces
- fails
- faithful
- far
- fear
- feelings
- few
- Fibonacci
- filled
- financial
- financial advice
- fine
- First
- first time
- Focus
- following
- For
- formed
- from
- FTX
- FUD
- fund
- Gain
- Gains
- gaming
- gearing
- General
- globe
- gone
- good
- great
- greatest
- Green
- green light
- Ground
- had
- Halving
- Hands
- happen
- Have
- head
- High
- higher
- Highlight
- Highs
- Hit
- hold
- holding
- How
- How High
- http
- HTTPS
- huge
- Hurt
- Hype
- ID
- ilv
- Impact
- in
- include
- Including
- increased
- increasingly
- index
- indicate
- indicates
- industry
- influence
- Informational
- interest
- into
- Inu
- investment
- investor
- Investors
- issues
- IT
- ITS
- just
- Justice
- keeps
- Key
- key resistance
- known
- Last
- lead
- leading
- left
- less
- Level
- light
- like
- likes
- little
- load
- Long
- long time
- Look
- looked
- looking
- LOOKS
- losses
- Low
- lower
- MACD
- made
- maintains
- major
- Making
- many
- map
- Market
- Market Capitalization
- max-width
- May..
- mean
- Memecoins
- mixed
- Momentum
- Month
- more
- most
- movement
- movements
- moving
- moving average
- moving averages
- much
- native
- Native Token
- Need
- needs
- negative
- negatively
- network
- never
- New
- news
- next
- number
- of
- off
- on
- On-Chain
- ONE
- open
- Opinion
- Opinions
- opportunities
- Opportunity
- or
- orders
- Other
- out
- outperformed
- over
- Paper
- part
- past
- pave
- paves
- Pay
- payment
- Perform
- performers
- personal
- pick
- Place
- plato
- Plato Data Intelligence
- PlatoData
- position
- potential
- Prepares
- pretty
- price
- PRICE ACTION
- Price Analysis
- price chart
- price rally
- Prices
- producing
- pumping
- Push
- Questions
- raised
- rally
- range
- ranging
- React
- reaction
- readers
- recovery
- Red
- reflect
- region
- regulations
- Rejected..
- relative
- relative strength index
- remained
- remaining
- remains
- research
- Resignation
- Resistance
- responsible
- restore
- result
- retracement
- Ripple
- Ripple (XRP)
- Rises
- Role
- rsi
- Run
- s
- Sanction
- Sanctions
- SAND
- saw
- see
- seeing
- seen
- sell
- Selling
- set
- SHIB
- Shibarium
- shocked
- should
- show
- shown
- Shows
- sign
- significant
- since
- soar
- SOL
- SOLVE
- Sources
- Spark
- Spot
- spot etf
- States
- steals
- stepping
- Still
- strength
- strong
- Struggle
- Struggles
- such
- suffered
- suffering
- suggest
- supply
- support
- Surrounding
- TAG
- taking
- terms
- test
- than
- Thanksgiving
- that
- The
- The Crypto Basic
- the world
- their
- These
- this
- this year
- time
- timeframe
- times
- to
- token
- Tokens
- took
- top
- top 5
- towards
- trade
- trader
- Traders
- trades
- Trend
- trigger
- Triple
- Turned
- two
- uncertainties
- Uncertainty
- United
- United States
- unprecedented
- us
- US DOJ
- USDT
- value
- views
- volume
- W3
- want
- was
- Watch
- Way..
- we
- webp
- weekend
- weekly
- Weeks
- WELL
- were
- whales
- What
- when
- which
- WHO
- with
- world
- worry
- would
- xrp
- year
- yearly
- years
- yet
- zephyrnet
- Zhao


