Bitcoin (BTC) bulls have mounted so much pressure on Bitcoin in the past week as the price struggles between $27,000 and $28,500 after seeing the price of Bitcoin rally with much price action in the past few days to a high of $28,500 before suffering price rejection to $27,000.
The price of Bitcoin, after breaking from its long-range price of $26,000, rallied to a high of $28,500 after the United States (US) announced an increased and much-improved employment data that had a positive impact on the financial market as the price of Bitcoin was not excluded.
Bitcoin, the largest cryptocurrency by market capitalization, saw an increase of 2% within a short time of the US government announcing its economy. It saw over 336,000 jobs added in September as this figure doubled the expectations of many economists.
Despite the great news for the financial market, the price rally from Bitcoin (BTC) was short-lived as the price dropped from $28,500 to a region of $27,900 as the price builds more momentum by bulls to break out of this range for a bullish run.
– Advertisement –
There has been so much speculation as regards the performance of Bitcoin and the general cryptocurrency market after Bitcoin’s correlation with long-term bonds saw a 12-month drop below its lowest in the last year.
With such signs developing, there has been a big shift in the performance of Bitcoin and its value in the coming year, as reported by IntotheBlock analyst Outumuro.
Statistics from Coin360.com indicate the market has gained considerably in the past few weeks as the whole cryptocurrency market saw a minimal price decline. There has been a low volume of orders across the cryptocurrency market as prices head into a new week.
The cryptocurrency market possesses so much potential for many traders and investors with fresh sentiments and fundamentals affecting the price actions of both Bitcoin and Ethereum and the weekly top 5 cryptos (SHIB, XRP, SOL, DOT, TOMO) we would be analyzing ahead of the week.
Bitcoin’s price remains a huge attraction for many traders and investors as price remains under the key region of interest for both Bitcoin (BTC) bulls and bears as a strong rejection in price from $28,500 could give bears much advantage to push price lower and a breakout above $28,500 could mean bulls in control.
For the first time in weeks, the price of BTC/USDT looks attractive to many traders and investors as the price shifts from its range of $25,800 to a high of $27900, trading just below its key resistance of $28,500 after suffering rejection in price from bears.
Bitcoin’s price continues to trade above the 50-day and 200-day Exponential Moving Averages (50-day and 200-day EMA) as these regions support the price of BTC/USDT from dropping lower.
The price of $27,000 corresponds to the support of the 50-day and 200-day EMA as bulls would be looking to push the price higher above $28,500 to a high of $29,500, a change in trend that has seen BTC/USDT remain dormant for some time.
Ethereum (ETH), unlike BTC, has remained in the shadows as its price struggles to break and form a strong support above $1,660.
The price of Ethereum saw an incredible price action in the past few weeks as the price rallied from a low of $1,600 to a high of $1,735 as many hoped for a close above $1,800 to kickstart a good run by bulls, but the price was rejected from this region.
Unlike Bitcoin, Ethereum continues to look short of encouraging as its volume and price action indicate the bears remain much in control despite a fakeout to a high of $1,735.
The price of Ethereum currently trades below the 50-day and 200-day EMA, which corresponds to the price at $1,670 and $1,735, acting as resistance for the price of Ethereum as the price needs to break and close above these regions for a bullish price rally.
The price of Bitcoin and Ethereum have less impacted the price of some promising altcoins as we would focus on these weekly top 5 cryptos (SHIB, XRP, SOL, DOT, TOMO). You should be paying close attention as we head into a new week.
Shiba Inu (SHIB) Price Analysis as a Weekly Top 5 Crypto
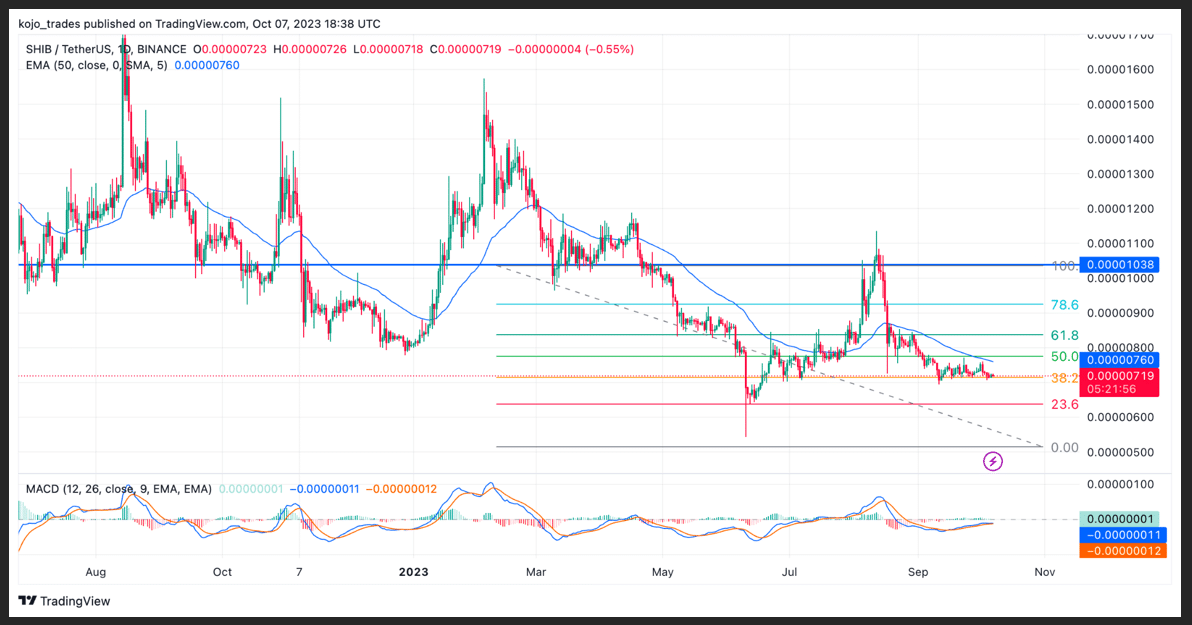

Shiba Inu (SHIB) has remained one of the most robust community and meme tokens despite so many ups and downs in the bear market that has left this meme coin dropping massively by over 70% as the bear market intensifies with many traders and investors hoping for a major bounce.
Shiba Inu’s army has remained loyal to this meme coin, considering the prospect it possesses after creating millionaires in crypto in the last bull run; many traders and investors are in no hurry to abandon this great token as many faithful still believe in its strength.
The price of SHIB/USDT has struggled in the previous week around $0.00000700 as the price struggled to hold above this region, supporting the price of SHIB/USDT. The price of SHIB/USDT needs to hold above this support region to prevent bears from driving the price of SHIB/USDT lower to a region of $0.00000600, where the price bounced off from the previous drop.
SHIB/USDT holding above $0.00000700 is good for the price to attempt a breakout to a high of $0.00000850. The support holding SHIB/USDT corresponds to the Fibonacci Retracement value of 38.2% (FIB value 38.2%), acting as support for SHIB/USDT.
The price of SHIB/USDT has remained in a range price movement for weeks as the SHIB army prepares to rally above its 50-day EMA, acting as resistance for the price of SHIB corresponding to $0.00000800.
The Moving Average Convergence Divergence (MACD) and Relative Strength Index (RSI) for SHIB/USDT on the daily timeframe shows that the price continues to build much strength, holding its key support as the price could rally to a high of $0.00000800 to attempt breaking above.
Major SHIB/USDT support zone – $0.00000700
Major SHIB/USDT resistance zone – $0.00000800 – $0.00000850
MACD trend – Bullish
Ripple (XRP) Chart Price Analysis on the Daily (1D) Timeframe
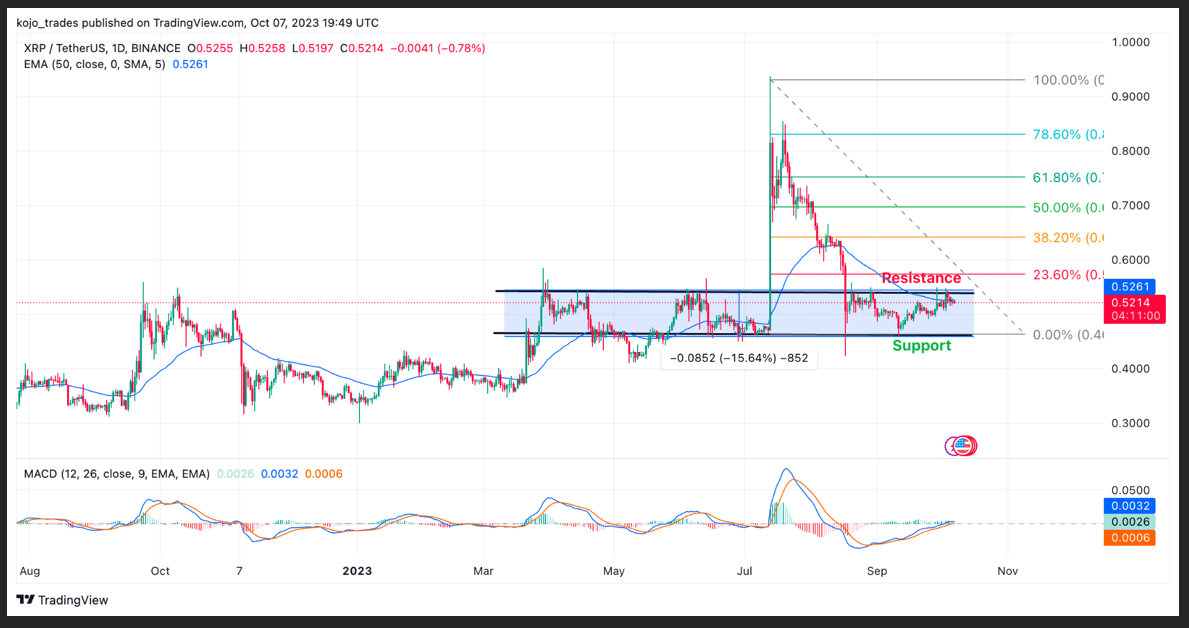

The future of Ripple (XRP) remains bullish ahead of the next crypto bull market. No wonder this token finds its way weekly in the top 5 cryptos to watch as analysts, traders, and investors believe a big future awaits XRP faithful.
Ripple’s (XRP) case ruling in its favor’s has been a huge catalyst for its growth and high speculation of creating an offset in the net bull run as the activities on XRP network continue to increase, hitting a new all-time high as there are speculations of XRP AMM functionality.
The news of including XRP Automated Market Maker (AMM) functionality has been welcomed by its community as there is so much anticipation when its implementation will be done. Ripple continues to build despite harsh market conditions as the future looks more promising.
The price of XRP/USDT has remained in a range-bound movement as the price of XRP/USDT struggled to match its on-chain activities as the price faced much rejection to break above $0.55.
The price of XRP/USDT continues to look bullish, with its daily MACD and RSI indicating buy orders as the price faces rejection twice to break out from its range of $0.5 to $0.55.
XRP/USDT trades just above its 50-day EMA, acting as support at $0.5 as the price faces the resistance of $0.55, corresponding to the 23.6% FIB value. A break and close above 23.6% could signal a bullish price rally for XRP.
Major XRP/USDT support zone – $0.5
Major XRP/USDT resistance zone – $0.55
MACD trend – Bullish
Solana (SOL) Price Chart Analysis as a Weekly Top 5 Cryptocurrency
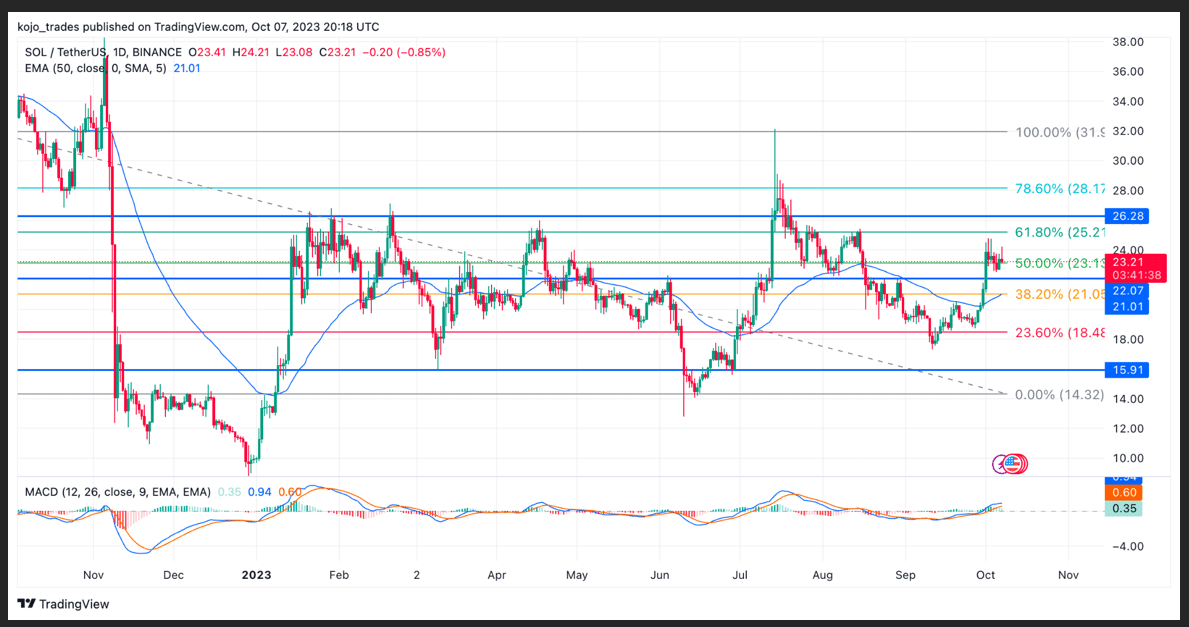

The announcement by the bankruptcy court to liquidate FTX assets has negatively impacted Solana’s price as the price dropped so much from a high of $22 to a region of $17.5, which has proved to be an area of interest in the past for bulls.
Following its initial impact on price dropping to a region of $17.5, the price of SOL/USDT has shown much strength by bulls rallying from this region to a high of $24.4 as a result of increased on-chain activities on the Solana network and the news of its network upgrade has been a good price catalyst.
With so much increase in the usage of decentralized applications (dApps) and volume increase due to nonfungible tokens (NFTs), the price of SOL/USDT could form a strong support above $23 to enable bulls to push prices higher.
After dropping to a low of $17.5, the price of SOL/USDT bounced to a high of $24.4 as the price dropped to $23, trading above its daily 50-day EMA as the price could aim to rally to $32.
The price of $23 corresponds with its 50% FIB value as its daily MACD and RSI for SOL/USDT indicate a bullish price scenario for SOL/USDT in the coming weeks.
Major SOL/USDT support zone – $22.5
Major SOL/USDT resistance zone – $25
MACD trend – Bullish
Polkadot (DOT) Price Chart Analysis
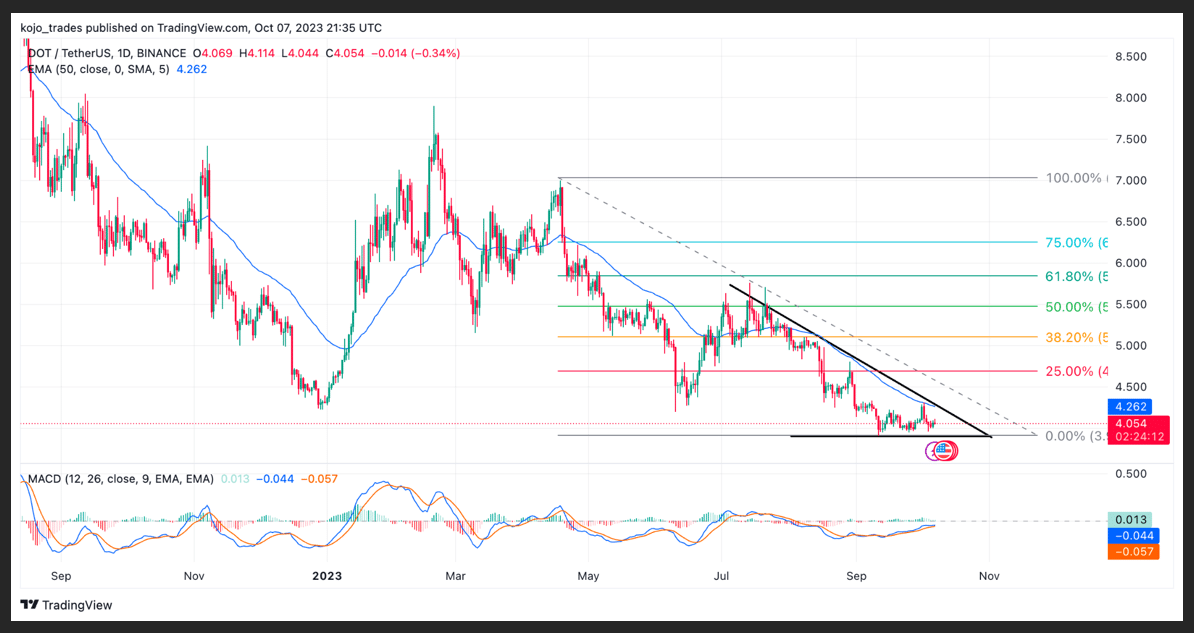

Polkadot (DOT) is known for its unique approach to multi-chain interactivity with groundbreaking technologies looking to revolutionize the blockchain industry as it has hit a rock recently, struggling to capitalize on its price.
Polkadot’s technologies to bridge various blockchains into a cohesive ecosystem have enabled it to gain much presence among the crypto communities. Still, its price has suffered many turbulent times in the crypto market as bears continue dominating prices.
The price of DOT/USDT continues to trade below the daily 50-day EMA at a region of $4.2 with what could look like the bottom after dropping from a high of $7.9, hitting a yearly high, but its price has struggled to replicate such a rally.
If the price of DOT/USDT is above $4.4, we could see price attempts to retest a high of $5, which corresponds to the FIB value of 25%; a break and close above $5 could mean more bullish price action for DOT/USDT.
The price of DOT/USDT has formed a bullish descending triangle as the cost would look to break out after trading in a bearish downtrend. The MACD and RSI for DOT/USDT indicate a bullish scenario at the bottom.
Major DOT/USDT support zone – $3.9
Major DOT/USDT resistance zone – $5
MACD trend – Bullish
TomoChain (TOMO) Price Analysis on the Daily Timeframe
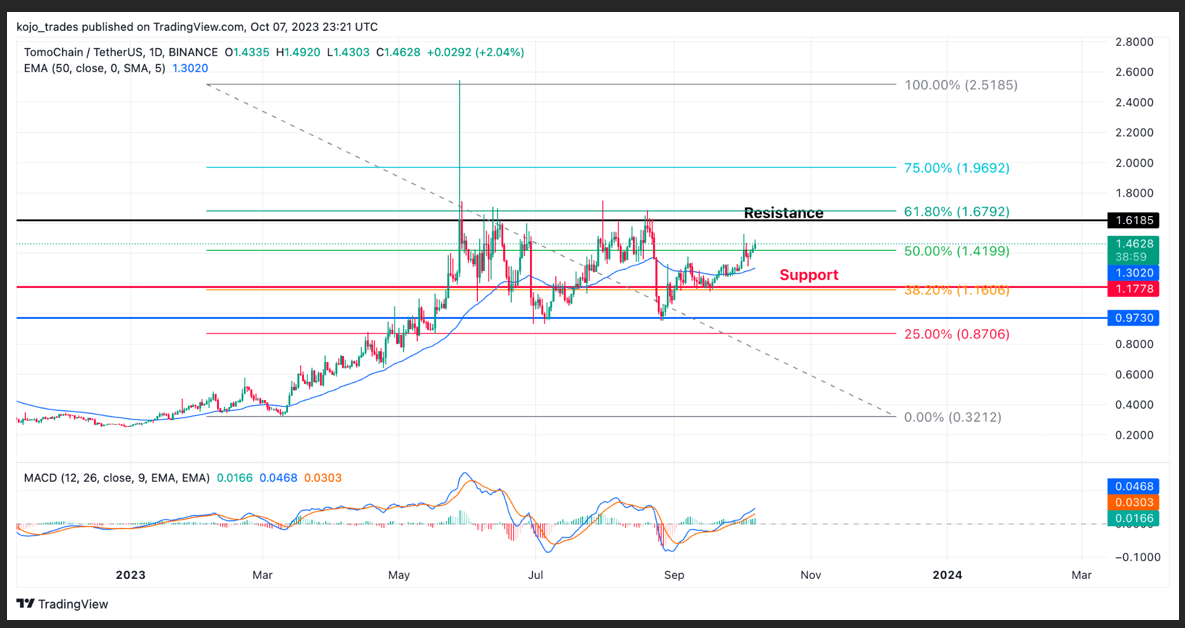

Tomochain (TOMO) has become a regular name in the crypto space. No wonder it is a gem to watch out for as a top 5 crypto altcoin, considering its huge potential.
TOMO/USDT remains a huge performer of 2023 after rallying from its low of $0.2 to a high of $2.7 before suffering price rejection to a low of $0.9 as the price bounced off from this region, forming a double bottom.
TOMO/USDT reclaimed $1.2, corresponding to 38.2% FIB value, forming a strong price support. TOMO/USDT currently trades above its 50-day EMA as price builds more bullish price action.
A break and close of TOMO/USDT above $1.6 could see price rally past $2 as bulls would be much in control of price considering its MACD and RSI looking bullish.
Major TOMO/USDT support zone – $3.9
Major TOMO/USDT resistance zone – $5
MACD trend – Bullish
Follow Us on Twitter and Facebook.
Disclaimer: This content is informational and should not be considered financial advice. The views expressed in this article may include the author’s personal opinions and do not reflect The Crypto Basic’s opinion. Readers are encouraged to do thorough research before making any investment decisions. The Crypto Basic is not responsible for any financial losses.
-Advertisement-
- SEO Powered Content & PR Distribution. Get Amplified Today.
- PlatoData.Network Vertical Generative Ai. Empower Yourself. Access Here.
- PlatoAiStream. Web3 Intelligence. Knowledge Amplified. Access Here.
- PlatoESG. Carbon, CleanTech, Energy, Environment, Solar, Waste Management. Access Here.
- PlatoHealth. Biotech and Clinical Trials Intelligence. Access Here.
- Source: https://thecryptobasic.com/2023/10/08/weekly-top-5-cryptos-you-should-watch-shiba-inu-xrp-sol-dot-tomo/?utm_source=rss&utm_medium=rss&utm_campaign=weekly-top-5-cryptos-you-should-watch-shiba-inu-xrp-sol-dot-tomo
- :has
- :is
- :not
- :where
- $3
- 000
- 11
- 2%
- 2023
- 23
- 500
- 7
- 9
- a
- above
- across
- acting
- Action
- actions
- activities
- added
- ADvantage
- Advertisement
- advice
- affecting
- After
- ahead
- aim
- Altcoin
- Altcoins
- AMM
- among
- an
- analysis
- analyst
- Analysts
- analyzing
- and
- announced
- Announcement
- Announcing
- anticipation
- any
- applications
- Applications (DApps)
- approach
- ARE
- AREA
- Army
- around
- article
- AS
- Assets
- At
- attempt
- Attempts
- attention
- attraction
- attractive
- author
- Automated
- Automated Market Maker
- average
- Bankruptcy
- Bankruptcy Court
- basic
- BE
- Bear
- Bear Market
- bearish
- Bears
- become
- been
- before
- believe
- below
- between
- Big
- Bitcoin
- bitcoin and ethereum
- Bitcoin Rally
- blockchain
- blockchain industry
- blockchains
- Bonds
- both
- Bottom
- Bounce
- bounced
- Break
- break out
- Breaking
- breakout
- BRIDGE
- BTC
- build
- builds
- bull
- Bull Market
- Bull Run
- Bullish
- Bulls
- but
- buy
- by
- capitalization
- capitalize
- case
- Catalyst
- change
- Chart
- Close
- cohesive
- Coin
- COM
- coming
- coming weeks
- Communities
- community
- conditions
- considered
- considering
- content
- continue
- continues
- control
- Convergence
- Correlation
- Corresponding
- corresponds
- Cost
- could
- Court
- Creating
- crypto
- crypto bull market
- crypto communities
- Crypto Market
- crypto space
- cryptocurrency
- cryptocurrency market
- cryptos
- Currently
- daily
- DApps
- data
- Days
- decentralized
- Decentralized Applications
- decisions
- Decline
- descending triangle
- Despite
- developing
- Divergence
- do
- dominating
- done
- DOT
- double
- double bottom
- doubled
- downs
- downtrend
- driving
- Drop
- dropped
- Dropping
- due
- economists
- economy
- ecosystem
- EMA
- employment
- enable
- enabled
- encouraged
- encouraging
- ETH
- ethereum
- excluded
- expectations
- exponential
- expressed
- faced
- faces
- faithful
- few
- Fibonacci
- Figure
- financial
- financial advice
- Financial Market
- finds
- First
- first time
- Focus
- For
- form
- formed
- fresh
- from
- FTX
- functionality
- Fundamentals
- future
- Gain
- gained
- Gem
- General
- Give
- good
- Government
- great
- groundbreaking
- Growth
- had
- Have
- head
- High
- higher
- Hit
- hitting
- hold
- holding
- hoping
- http
- HTTPS
- huge
- Impact
- impacted
- implementation
- in
- include
- Including
- Increase
- increased
- incredible
- index
- indicate
- industry
- Informational
- initial
- Intensifies
- interactivity
- interest
- into
- intotheblock
- Inu
- investment
- Investors
- IT
- ITS
- Jobs
- just
- Key
- key resistance
- known
- largest
- Last
- Last Year
- left
- less
- like
- liquidate
- long-term
- Look
- look like
- looking
- LOOKS
- losses
- Low
- lower
- lowest
- loyal
- MACD
- major
- maker
- Making
- many
- Market
- Market Capitalization
- market conditions
- market maker
- massively
- Match
- max-width
- May..
- mean
- meme
- meme coin
- Meme Tokens
- millionaires
- minimal
- Momentum
- more
- most
- movement
- moving
- moving average
- moving averages
- much
- multi-chain
- name
- needs
- negatively
- net
- network
- New
- news
- next
- NFTs
- no
- NonFungible
- Nonfungible Tokens
- of
- off
- offset
- on
- On-Chain
- ONE
- Opinion
- Opinions
- orders
- out
- outumuro
- over
- past
- paying
- performance
- performer
- personal
- plato
- Plato Data Intelligence
- PlatoData
- positive
- potential
- Prepares
- presence
- pressure
- prevent
- previous
- price
- PRICE ACTION
- Price Analysis
- price chart
- price rally
- Prices
- promising
- prospect
- proved
- Push
- rally
- range
- readers
- recently
- reflect
- regards
- region
- regions
- regular
- Rejected..
- relative
- relative strength index
- remain
- remained
- remains
- Reported
- research
- Resistance
- responsible
- result
- retracement
- revolutionize
- Ripple
- Ripple (XRP)
- robust
- Rock
- rsi
- ruling
- Run
- s
- saw
- scenario
- see
- seeing
- seen
- sentiments
- September
- SHIB
- SHIB army
- Shiba
- Shiba Inu
- shift
- Shifts
- Short
- should
- shown
- Shows
- Signal
- Signs
- So
- SOL
- Solana
- some
- Space
- speculation
- States
- Still
- strength
- strong
- Struggles
- Struggling
- such
- suffered
- suffering
- support
- Supporting
- Technologies
- that
- The
- The Crypto Basic
- The Future
- The Weekly
- There.
- These
- this
- time
- timeframe
- times
- to
- token
- Tokens
- top
- top 5
- trade
- Traders
- trades
- Trading
- Trend
- turbulent
- Twice
- under
- unique
- United
- United States
- unlike
- upgrade
- UPS
- us
- us government
- Usage
- USDT
- USDT Price
- value
- various
- views
- volume
- W3
- was
- Watch
- Way..
- we
- webp
- week
- weekly
- Weeks
- welcomed
- What
- when
- which
- whole
- will
- with
- within
- wonder
- would
- xrp
- year
- yearly
- You
- zephyrnet


