XinFin is an enterprise-ready hybrid Blockchain technology company optimized for international trade and finance. The XinFin network is powered by the native coin called XDC. The XDC protocol is developed to support smart contracts, 2000TPS, 2 seconds of transaction time, and KYC to Master nodes (Validator Nodes). The XDC Chain (XinFin Digital Contract) uses XinFin Delegated Proof of Stake (XDPoS) protocol intending to create a ‘highly-scalable, secure, permission, and commercial grade’ blockchain network. Let us look at the technical analysis of XDC.
Past Performance
XDC opened for trading at $0.099 on October 25, 2021. The week witnessed continuation in the formation of lower lows and ended with a close at $0.1023. The weekly change was 3.33%.

XDC Technical Analysis
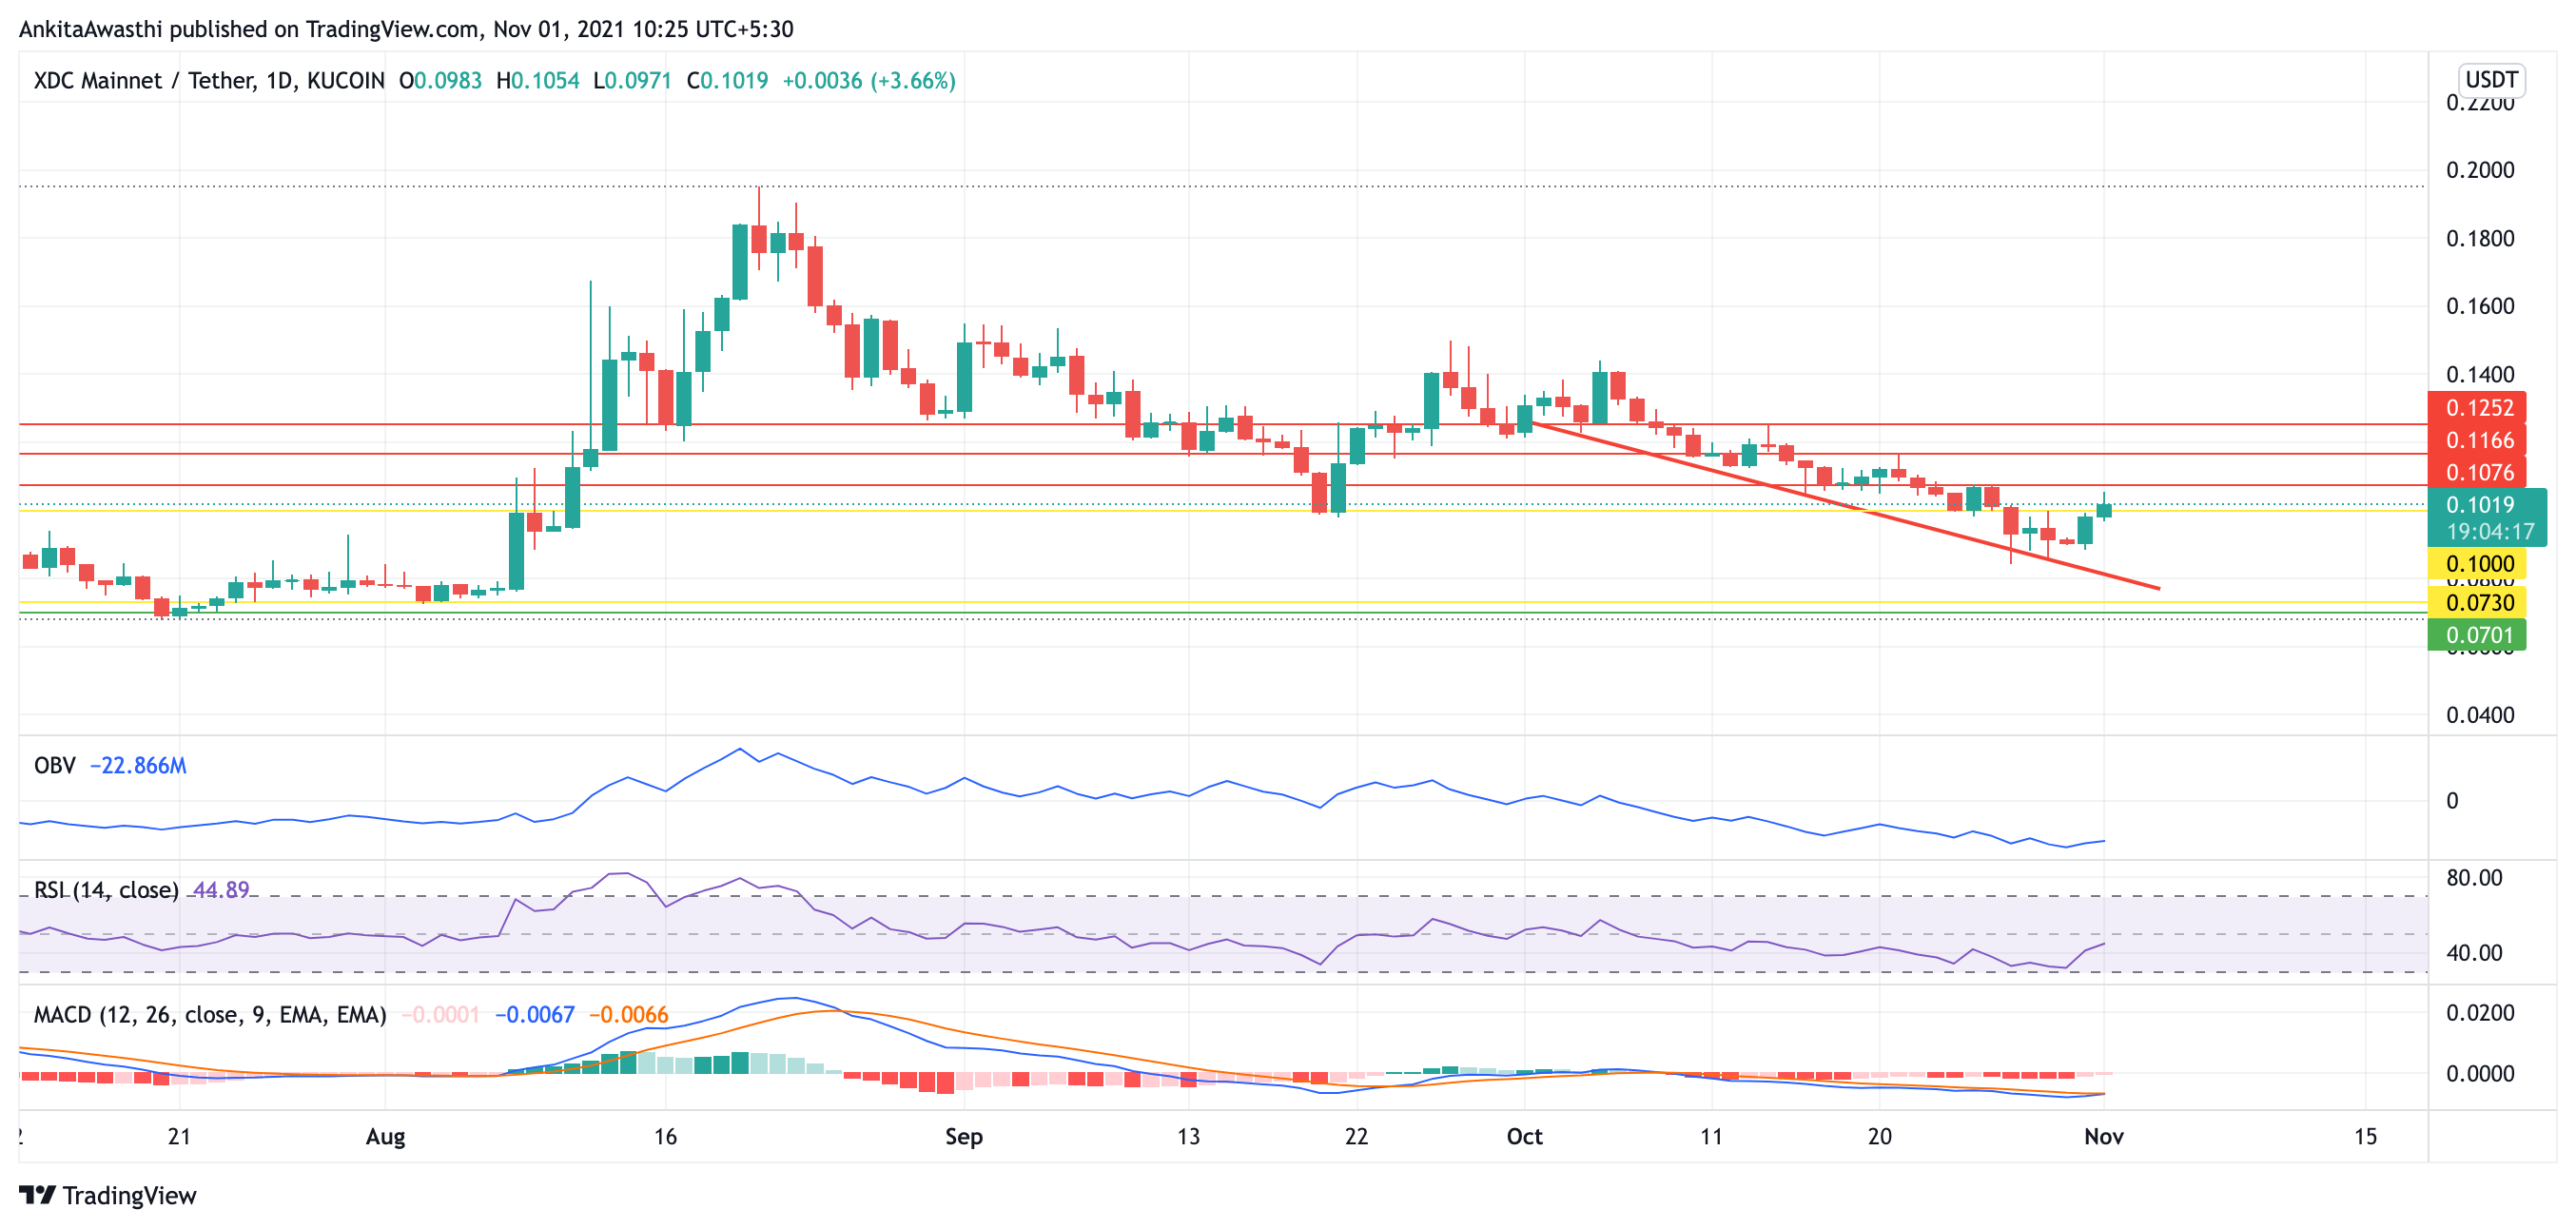
The trading price for XDC is taking descending support right now. In between, it made unsuccessful attempts of a trend reversal when it faced resistance at $0.1252 and $0.1166. Currently, resistance at $0.1076 is being tested. The current trading price is $0.1019, which is 3.66% higher than yesterday’s close. This is a bullish signal. Let us have a look at indicators.
OBV is another technical trading momentum indicator that uses volume flow to predict changes in the stock price. The line chart of OBV is showing an incline at the end. This is a positive signal, which means that the buying pressure is higher than the selling pressure.
Meanwhile, the overall volume of XDC is stable for the last few days.
RSI is also bouncing from 44.89%. This shows the increasing strength of the price. This is a bullish signal, meaning the traders can take a long position if an uptrend starts.
A bullish crossover can be seen in MACD. This is a strong buying point, signaling traders to take a long position. The fast and the slow lines are positive as well. Moving Average is the average of the closing XDC/USD price over a given number of periods. The 200-day simple moving average is one of the most-watched activities in the price charts by mostly all experienced traders.
Meanwhile, XDC has also collaborated with wadzpay for a Q/A in their community. The XDC Network has released a collection of multiplatform software development kits (SDKs), covering iOS, Android, .NET, Java, and Go.
Day-Ahead and Tomorrow
The oscillators are giving strong positive signals for the XDC price to go up. However, we have to wait for the price to cross the previous resistances, as the downtrend has not ended yet. Meanwhile, traders can keep the stop-loss at $0.0701.
Fib Retracement shows that the previous support by the price chart was the pivot point of $0.08. The Fib level at $0.1 is currently being tested.
- 11
- 9
- activities
- All
- analysis
- android
- blockchain
- blockchain technology
- Bullish
- Buying
- change
- Charts
- Coin
- commercial
- community
- company
- continues
- contract
- contracts
- Current
- Development
- digital
- FAST
- finance
- flow
- Giving
- HTTPS
- Hybrid
- International
- iOS
- IT
- Java
- KYC
- Level
- Line
- Long
- Momentum
- net
- network
- nodes
- Pivot
- pressure
- price
- proof
- protocol
- Simple
- smart
- Smart Contracts
- Software
- software development
- stake
- stock
- support
- Technical
- Technical Analysis
- Technology
- time
- trade
- Traders
- Trading
- transaction
- us
- volume
- wait
- week
- weekly


