XRP has been moving downwards since April but has bounced at the long-term $0.60 horizontal support area.
While the direction of the long-term trend is unclear, the price has broken out from a short-term resistance line.
Long-term XRP movement
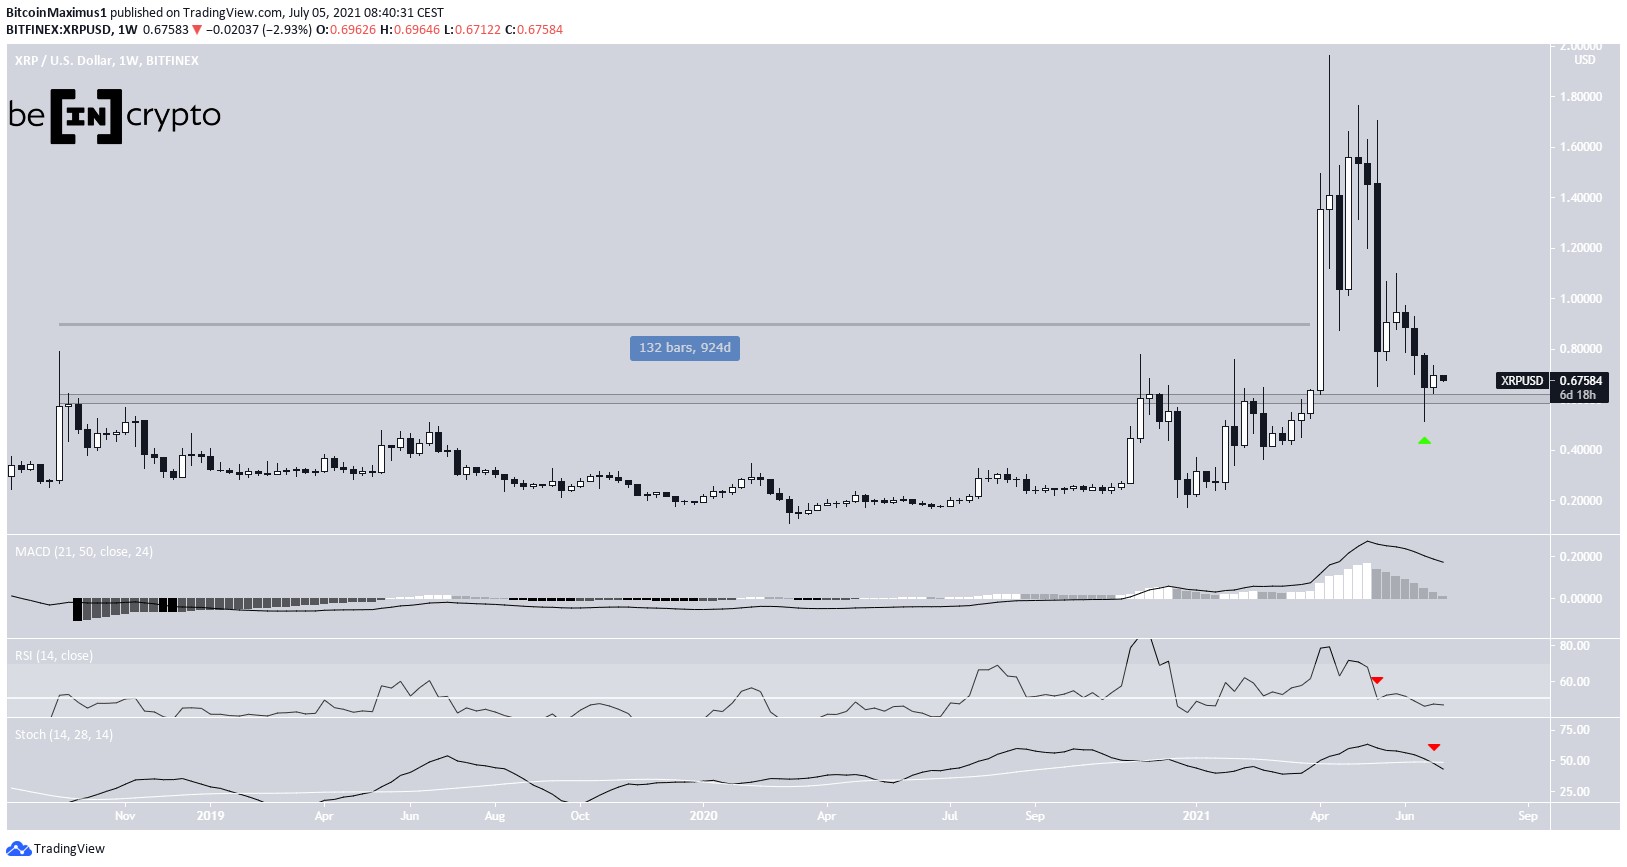
XRP has been moving downwards since reaching a high of $1.96 on April 14. The downward movement continued until a low of $0.51 was reached on June 22.
Its price has bounced since, validating the long-term $0.60 horizontal area as support. Prior to breaking out in March, XRP had consolidated below this level for 924 days.
However, despite the bounce, long-term technical indicators are still bearish. The RSI is below 50 and the Stochastic oscillator has made a bearish cross. Furthermore, the MACD histogram is nearly negative.
Therefore, while the price action seems bullish due to the retest, technical indicators are bearish.
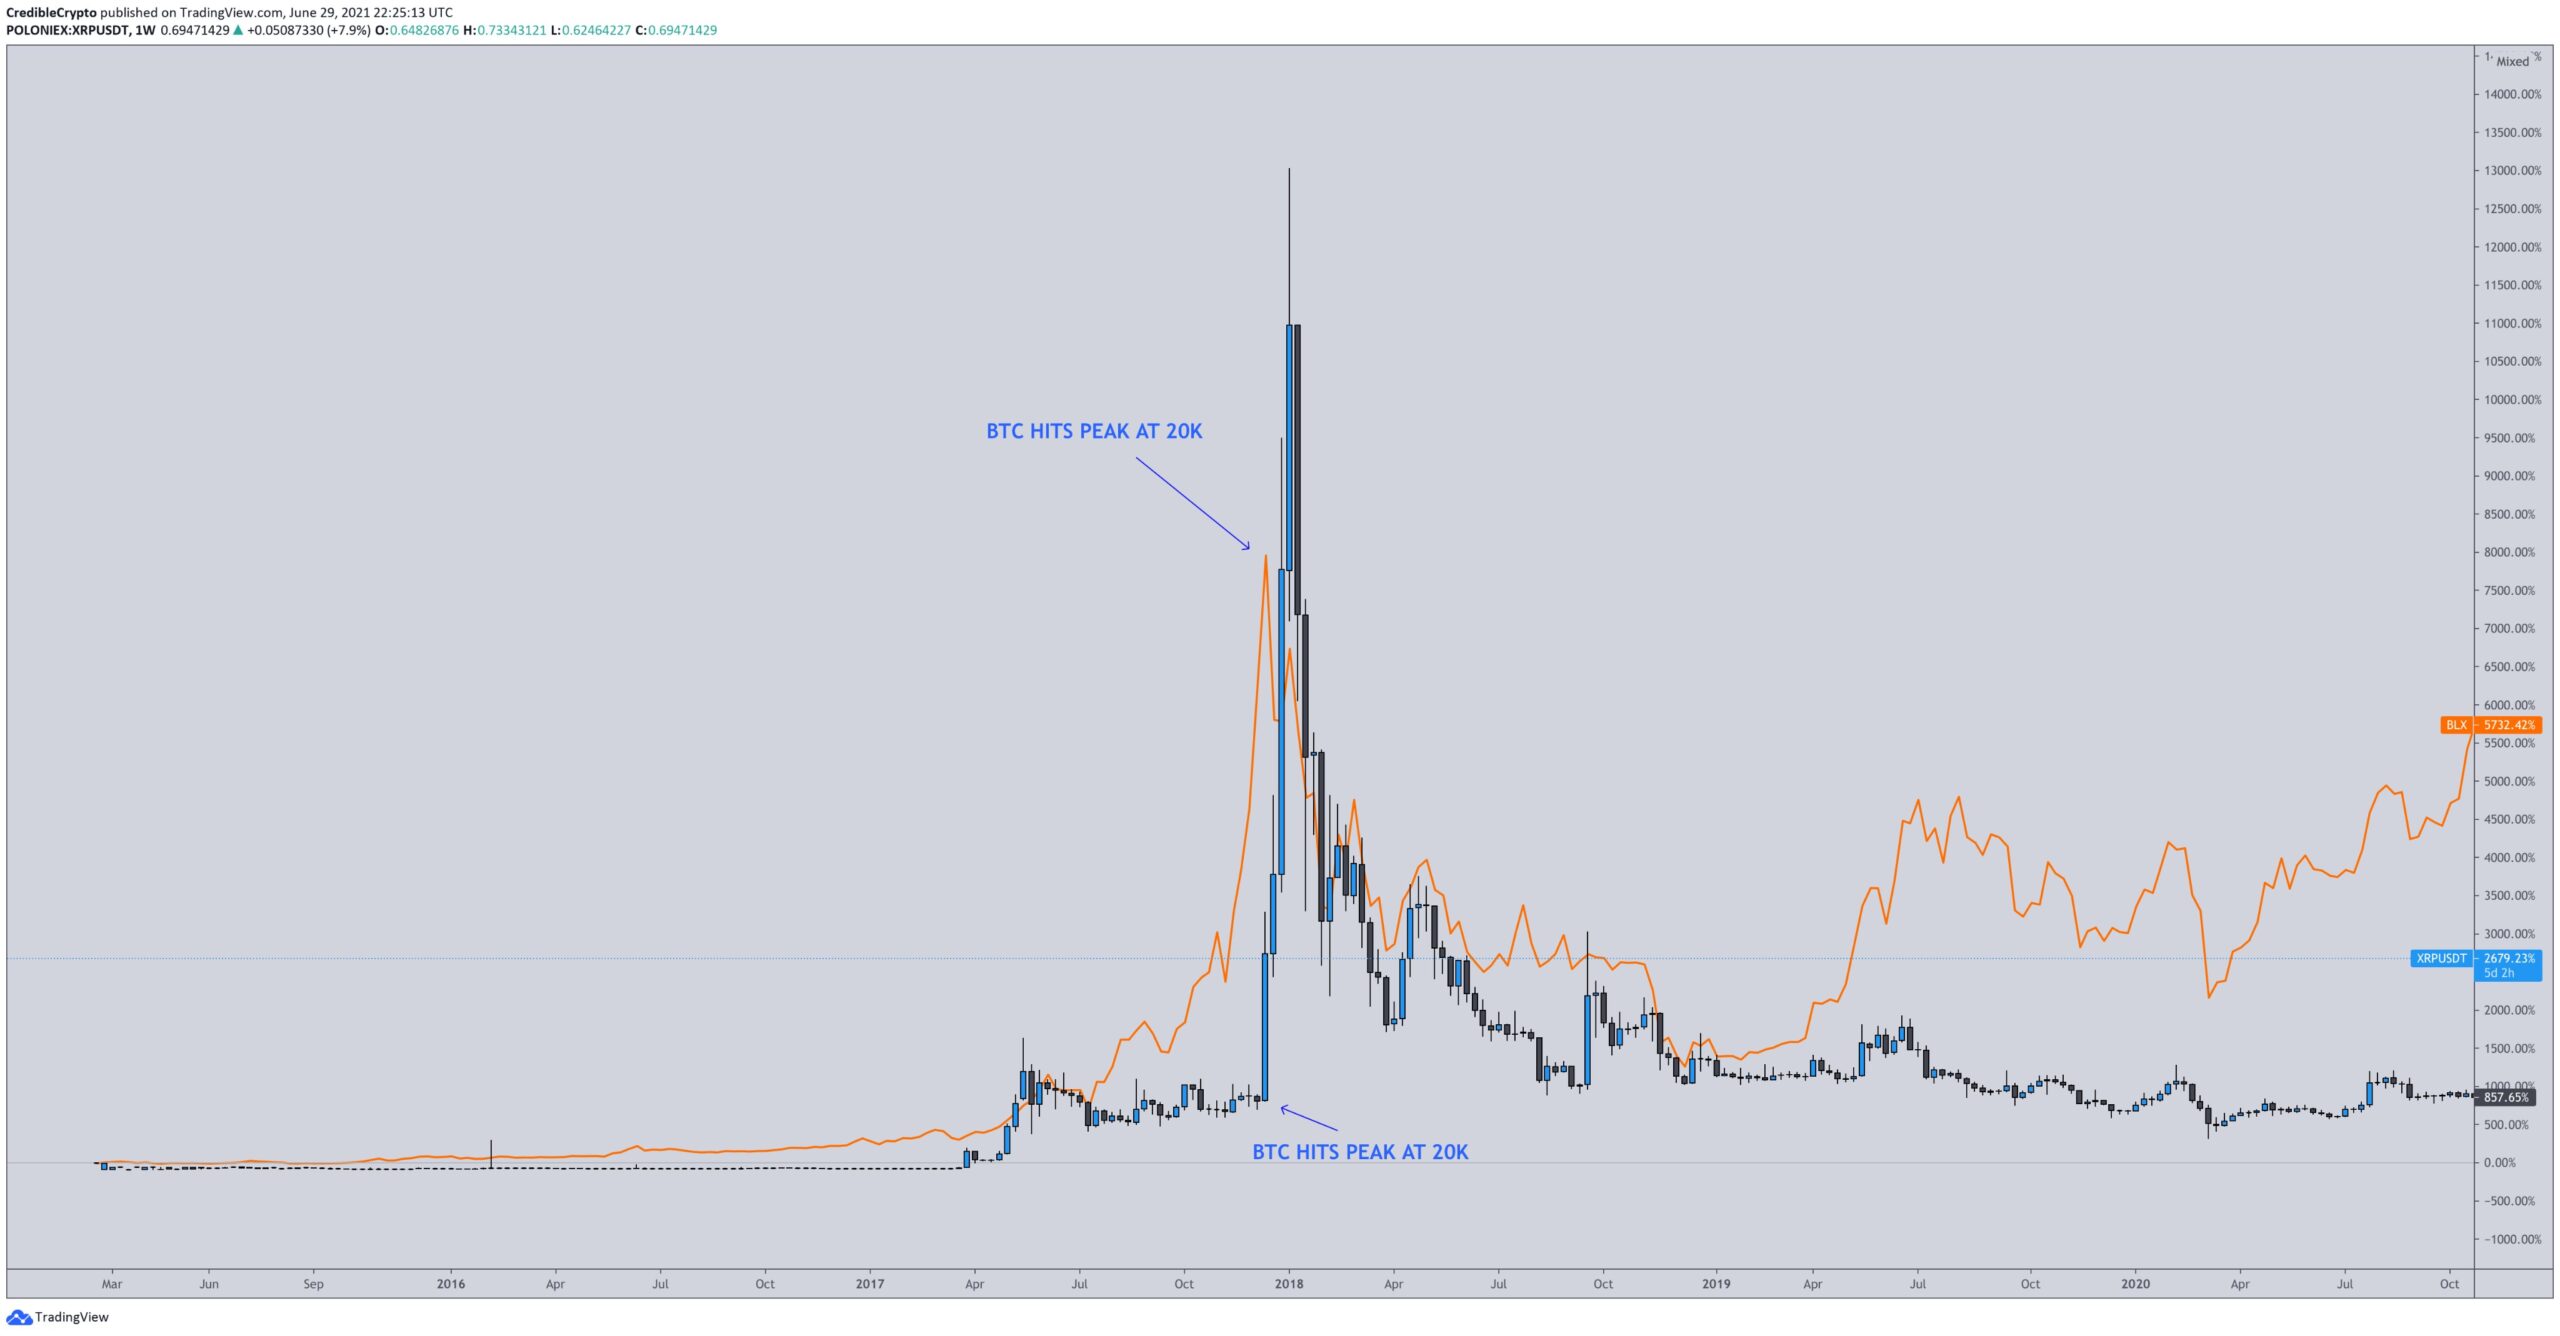
Cryptocurrency trader @Crediblecrypto outlined an XRP chart, stating that the trend is bullish despite its slow start, since a similarly lagging movement transpired in 2018. As we saw in March, a sharp breakout followed a very long period of consolidation. Since it’s still trading above that level at $0.60, the price action remains bullish.
Descending support
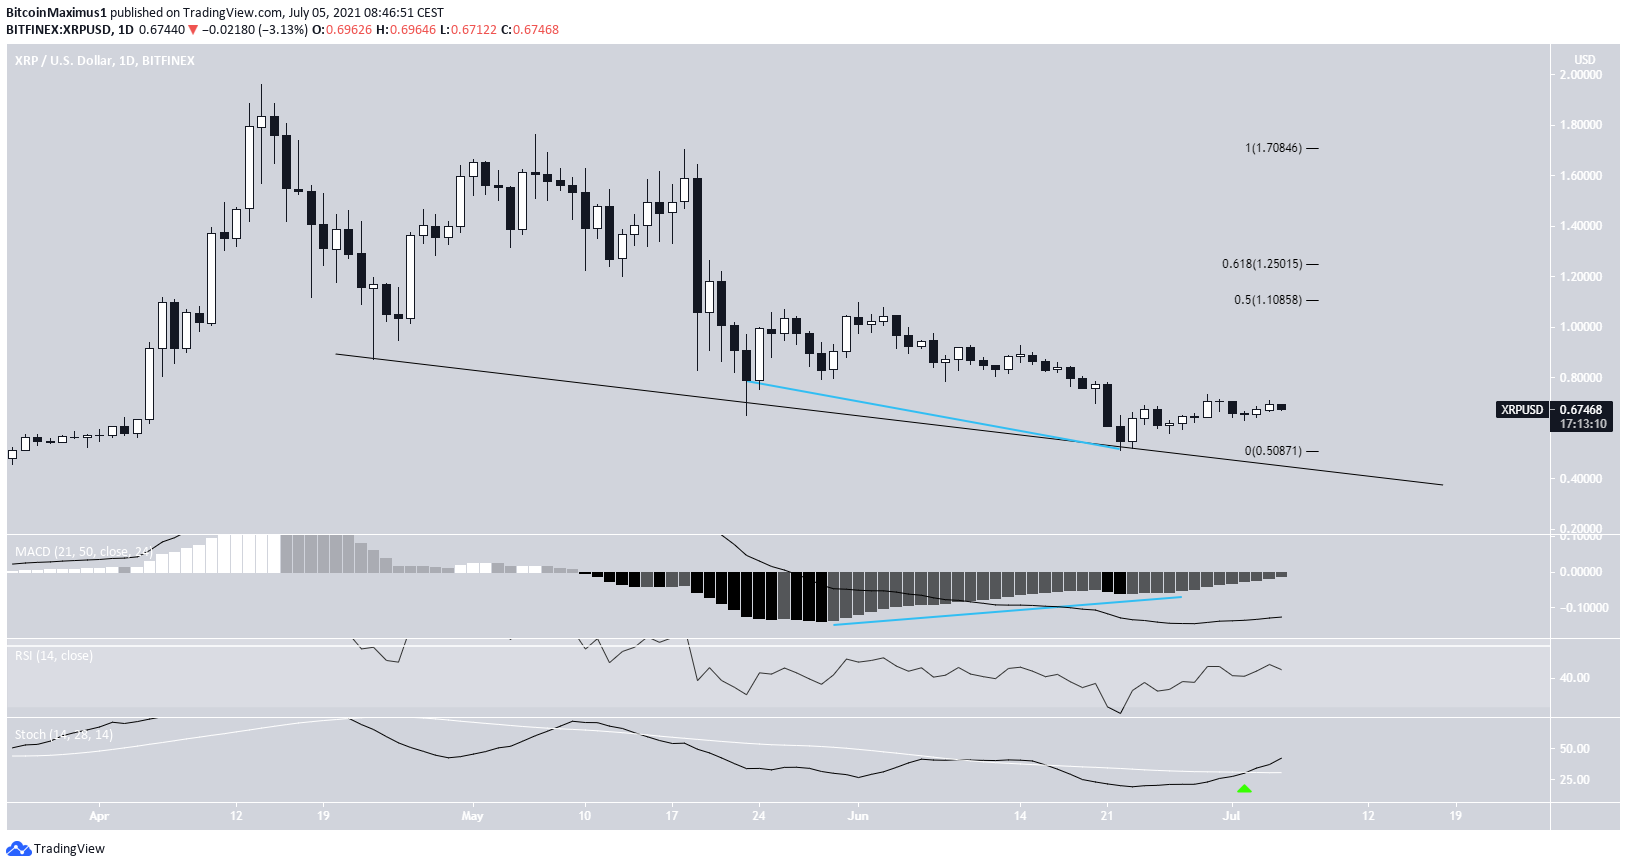
The daily chart shows that XRP has been decreasing alongside a descending support line since April 23. So far, the line has been touched multiple times, most recently on June 22.
The ongoing upward movement was preceded by a bullish divergence in the MACD (blue line). In addition to this, the Stochastic oscillator has made a bullish cross and the RSI has moved above 30.
The main resistance area is found between $1.11 and $1.25. This range is the respective 0.5-0.618 Fib retracement resistance levels.
While the daily chart provides a more bullish outlook than the weekly one, it’s not enough to confirm a bullish reversal.
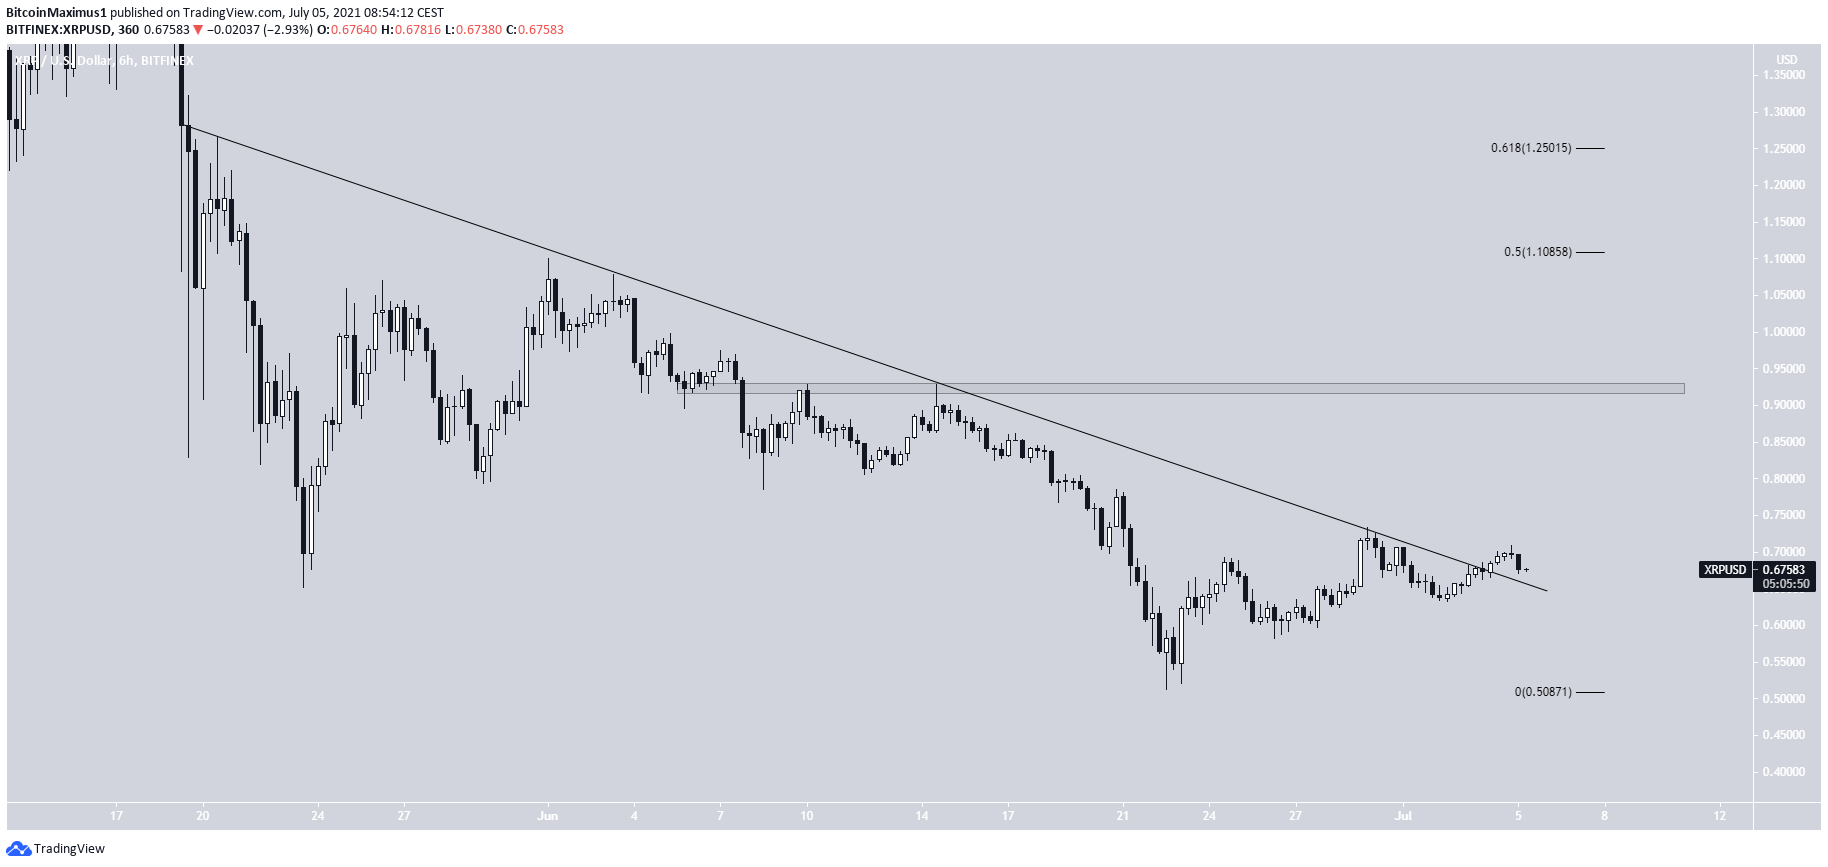
The six-hour XRP chart is more bullish, since it shows a breakout from a descending resistance line. Therefore, it would make sense for an upward movement to follow. Its first target is the $0.92 resistance but the price could potentially move up to the $1.11-$1.25 area.
Wave count
There are two main wave counts that could likely transpire. In the first scenario, the decrease since the April high has been a leading diagonal.
In this case, an upward movement would follow, most likely towards the previously outlined resistance area between $1.11-$1.26.
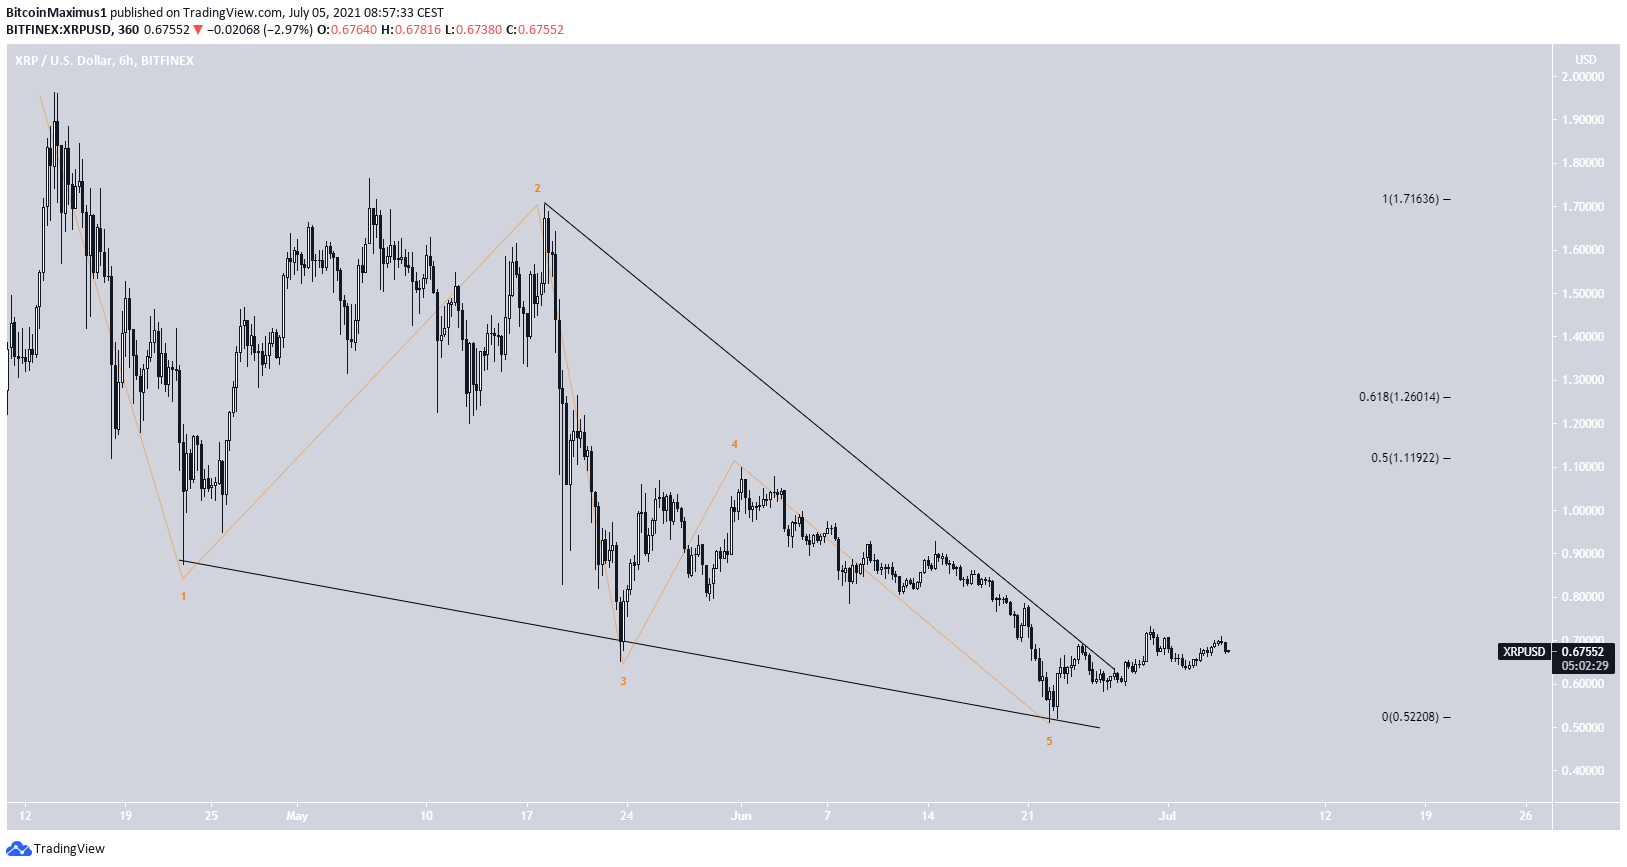
The other wave count, the current increase is part of the X wave of a W-X-Y corrective structure (orange). In this case, the upward movement should be weaker, reaching a maximum of $1.10 and potentially ending in the $0.92 area.
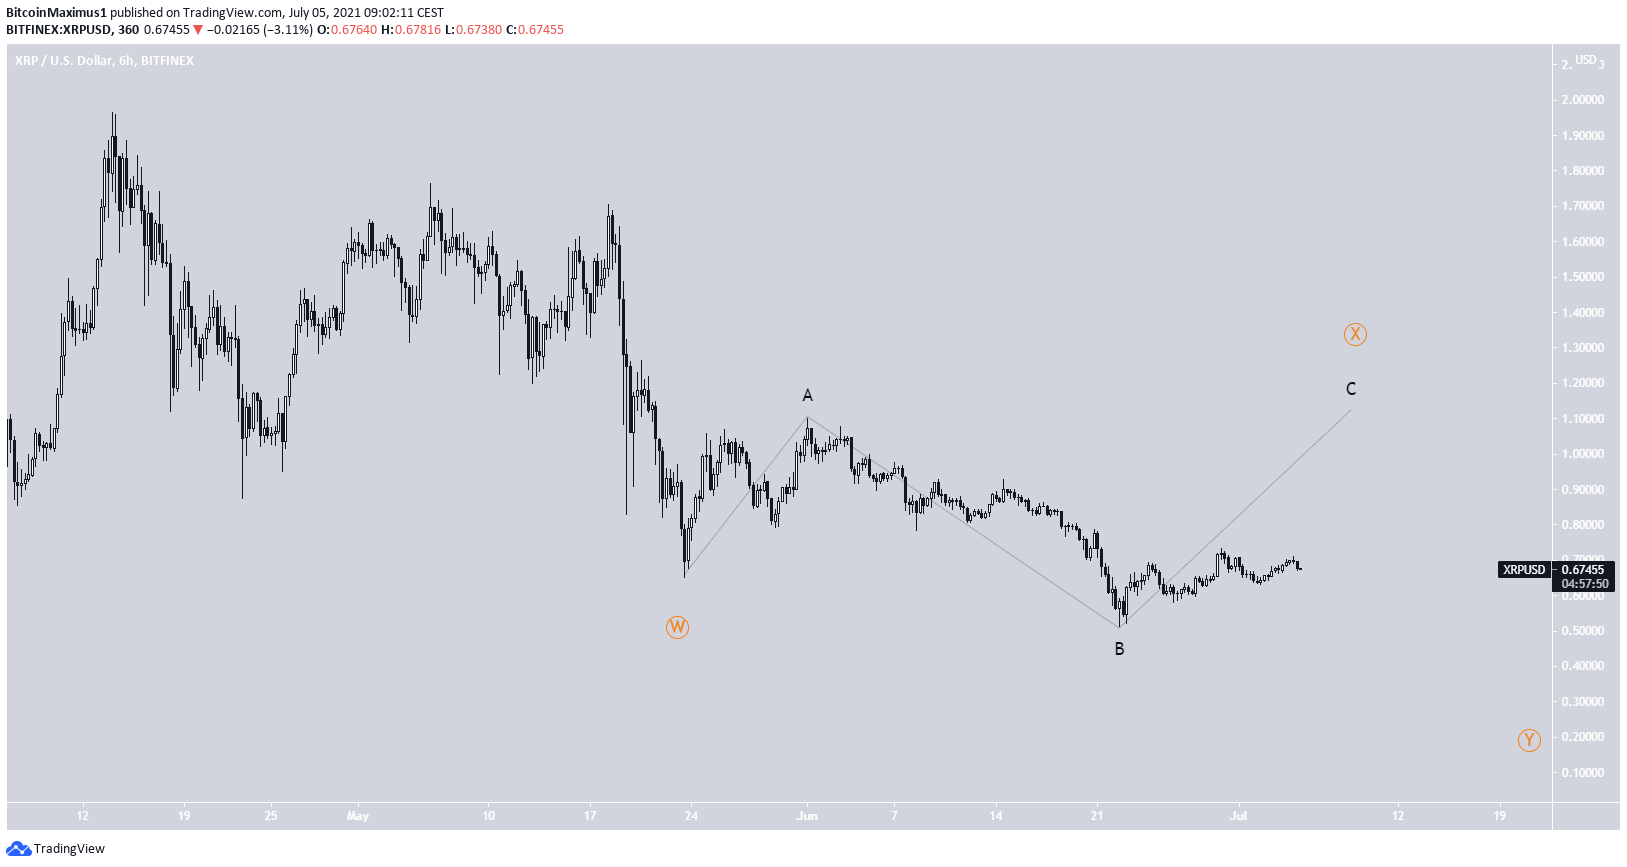
So, while the direction of the long-term trend is not clear, both wave counts forsee XRP moving upwards in the short-term prior to another eventual drop.
For BeInCrypto’s latest bitcoin (BTC) analysis, click here.
Disclaimer
All the information contained on our website is published in good faith and for general information purposes only. Any action the reader takes upon the information found on our website is strictly at their own risk.
Source: https://beincrypto.com/xrp-maintains-bullish-trading-structure-despite-fall/
- 11
- Action
- All
- analysis
- analyst
- April
- AREA
- barcelona
- bearish
- breakout
- BTC
- Bullish
- consolidation
- cryptocurrencies
- cryptocurrency
- Current
- data
- discovered
- Drop
- Economics
- financial
- First
- follow
- General
- good
- graduate
- here
- High
- HTTPS
- Increase
- information
- IT
- latest
- Level
- Line
- Long
- March
- Markets
- move
- Other
- Outlook
- price
- range
- Reader
- Risk
- School
- sense
- So
- start
- support
- Target
- Technical
- trader
- Trading
- Wave
- Website
- websites
- weekly
- writing
- X
- xrp
- youtube


