SNEAK PEEK
- XRP market remains bullish despite correction signs.
- Bulls dominate XRP with rising prices and optimistic investors.
- Market volatility affects XRP trading volume, but optimism remains.
According to a recent tweet on the XRP market (XRP), the daily S-RSI is topping, and the RSI is still behaving as resistance on the Descending Channel. Trading may slow down or dip a little, but there is no cause for concern on the macro level. While the market has exhibited signs of correction and consolidation, this is not necessarily cause for alarm. The overall trend is still bullish, and many things point to this trend continuing over the long term.
#XRP Close Above it, Push ( Update):
The Descending Channel is still acting as resistant & the daily S-RSI is topping & the #RSI is trending down words. So we might cool-off or dip a little bit but on the MACRO nothing to worry about. #XRPArmy STAY STEADY BECAUSE IN THE… https://t.co/WxzomxC9PY pic.twitter.com/DQgu7k5b49
— EGRAG CRYPTO (@egragcrypto) May 20, 2023
Therefore, bulls have dominated the XRP market in the past 24 hours, driving prices from an intraday low of $0.4602 to an intraday high of $0.4738. As of press time, XRP was trading at $0.4648, a 0.92% increase from the previous closing.
XRP’s market capitalization increased by 0.98% to $24,112,308,432, while the 24-hour trading volume decreased by 42.79% to $860,614,142.This rise in market capitalization shows that investors are still willing to hold onto their investments and remain optimistic about the market’s long-term potential. However, the drop in trading volume might be attributed to market volatility.
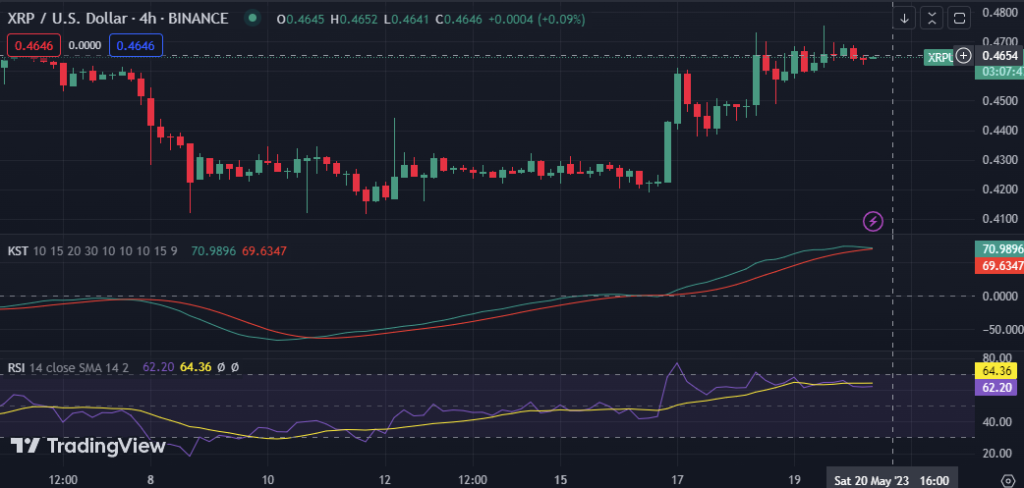
The Know Sure Thing (KST), which has a reading of 70.9313 and has moved above its signal line, indicates that the market’s bullish momentum is gaining strength. If the KST line crosses beneath the signal line, which could be interpreted as a sell signal, investors might consider liquidating their long positions or establishing new ones.
The bullish momentum is supported by the Relative Strength Index (RSI) reading of 62.20, which is above the 50-point threshold and indicates more buying pressure than selling pressure. The bullish momentum may, however, be waning as the RSI crosses below its signal line, requiring traders to set a stop loss.

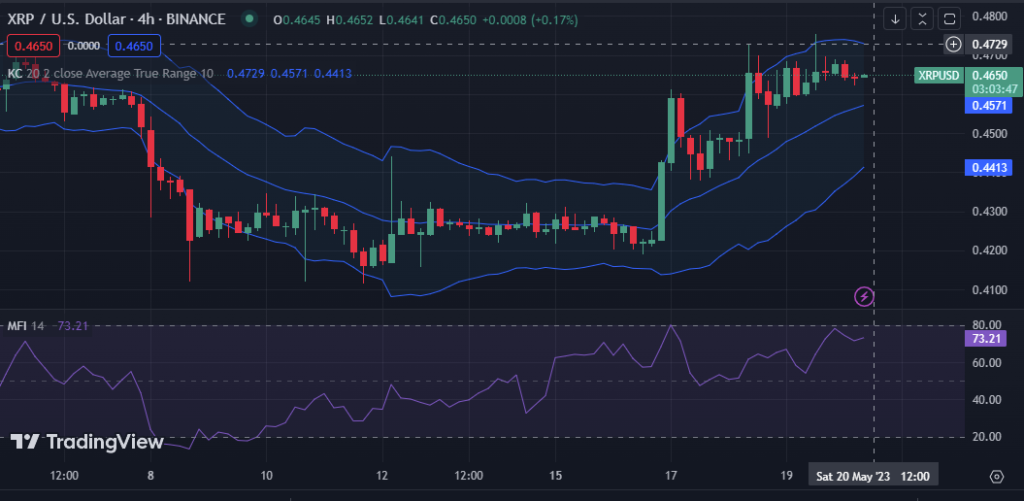
The Keltner Channel bands are pointing northward on the 4-hour price chart for XRP, indicating a bullish trend, with upper and lower readings of 0.4729 and 0.4413, respectively. Traders may want to buy XRP now with a sell target price near the upper Keltner Channel.
Green candlesticks develop as price action rises and crosses above the middle band, supporting the bullish momentum. However, when the bulls’ strength starts to wane, traders should be aware of potential resistance levels and use a stop loss to minimize risk.
On the 4-hour price chart, XRP has a strong bullish trend with a Money Flow Index (MFI) rating 73.20, indicating buyers control the market. Traders may hold onto their present long positions or establish new ones until the MFI rating drops below 50.

In conclusion, despite signs of correction, XRP’s bullish trend remains strong, driven by optimistic investors and rising prices. Market volatility affects trading volume, but long-term potential keeps optimism intact.
Disclaimer: Cryptocurrency price is highly speculative and volatile and should not be considered financial advice. Past and current performance is not indicative of future results. Always research and consult with a financial advisor before making investment decisions.
- SEO Powered Content & PR Distribution. Get Amplified Today.
- PlatoAiStream. Web3 Data Intelligence. Knowledge Amplified. Access Here.
- Minting the Future w Adryenn Ashley. Access Here.
- Buy and Sell Shares in PRE-IPO Companies with PREIPO®. Access Here.
- Source: https://investorbites.com/xrp-price-analysis-05-20/
- :has
- :is
- :not
- 10
- 20
- 22
- 24
- 50
- 7
- 70
- a
- About
- above
- Action
- advice
- advisor
- alarm
- always
- an
- analysis
- and
- ARE
- AS
- At
- aware
- BAND
- BE
- because
- before
- below
- beneath
- Bit
- Bullish
- Bulls
- but
- buy
- buyers
- Buying
- by
- candlesticks
- capitalization
- Cause
- Center
- Channel
- Chart
- Close
- closing
- Concern
- conclusion
- Consider
- considered
- consolidation
- continuing
- control
- could
- crypto
- Current
- daily
- decisions
- Despite
- develop
- Dip
- Dominate
- down
- driven
- driving
- Drop
- Drops
- establish
- establishing
- external
- financial
- financial advice
- flow
- For
- from
- future
- gaining
- Have
- High
- highly
- hold
- HOURS
- However
- HTTPS
- if
- in
- Increase
- increased
- index
- indicates
- internal
- investment
- Investments
- investor
- Investors
- IT
- ITS
- Know
- Level
- levels
- Line
- little
- Long
- long-term
- loss
- Low
- lower
- Macro
- Making
- many
- Market
- Market Capitalization
- Market News
- market volatility
- max-width
- May..
- Middle
- might
- Momentum
- money
- more
- Near
- necessarily
- New
- news
- no
- nothing
- now
- of
- on
- ones
- Optimism
- Optimistic
- or
- over
- overall
- past
- performance
- plato
- Plato Data Intelligence
- PlatoData
- Point
- positions
- potential
- present
- press
- pressure
- previous
- price
- PRICE ACTION
- Price Analysis
- price chart
- Prices
- Push
- rating
- Reading
- relative strength index
- remain
- remains
- research
- Resistance
- resistant
- respectively
- Results
- Ripple
- Ripple News
- Rise
- Rises
- rising
- Risk
- rsi
- s
- sell
- Selling
- set
- should
- Shows
- Signal
- Signs
- slow
- So
- Source
- speculative
- starts
- stay
- steady
- Still
- Stop
- strength
- strong
- Supported
- Supporting
- Target
- term
- than
- that
- The
- their
- There.
- thing
- things
- this
- threshold
- time
- to
- Traders
- Trading
- trading volume
- TradingView
- Trend
- trending
- tweet
- until
- Update
- use
- volatile
- Volatility
- volume
- want
- was
- we
- when
- which
- while
- willing
- with
- words
- worry
- xrp
- XRP Price
- XRP price analysis
- XRP/USD
- zephyrnet


