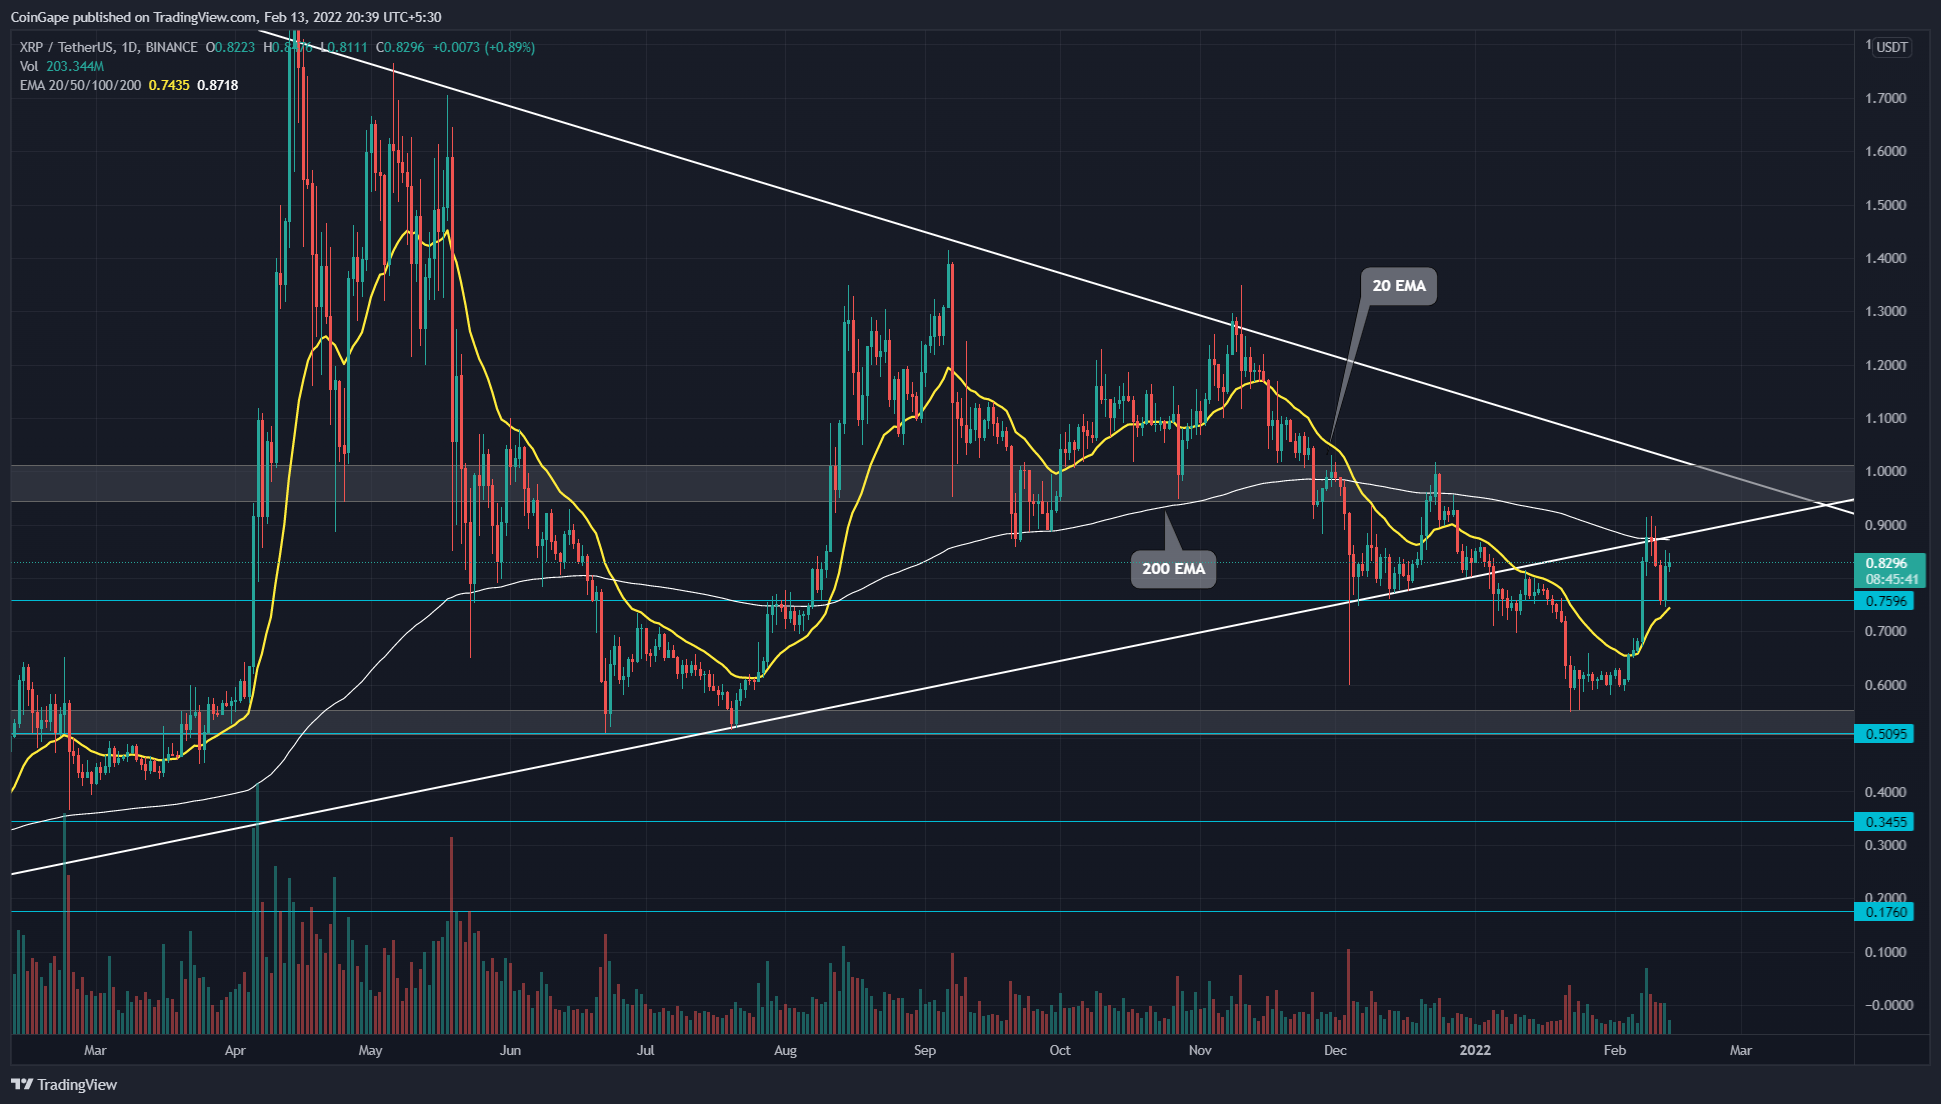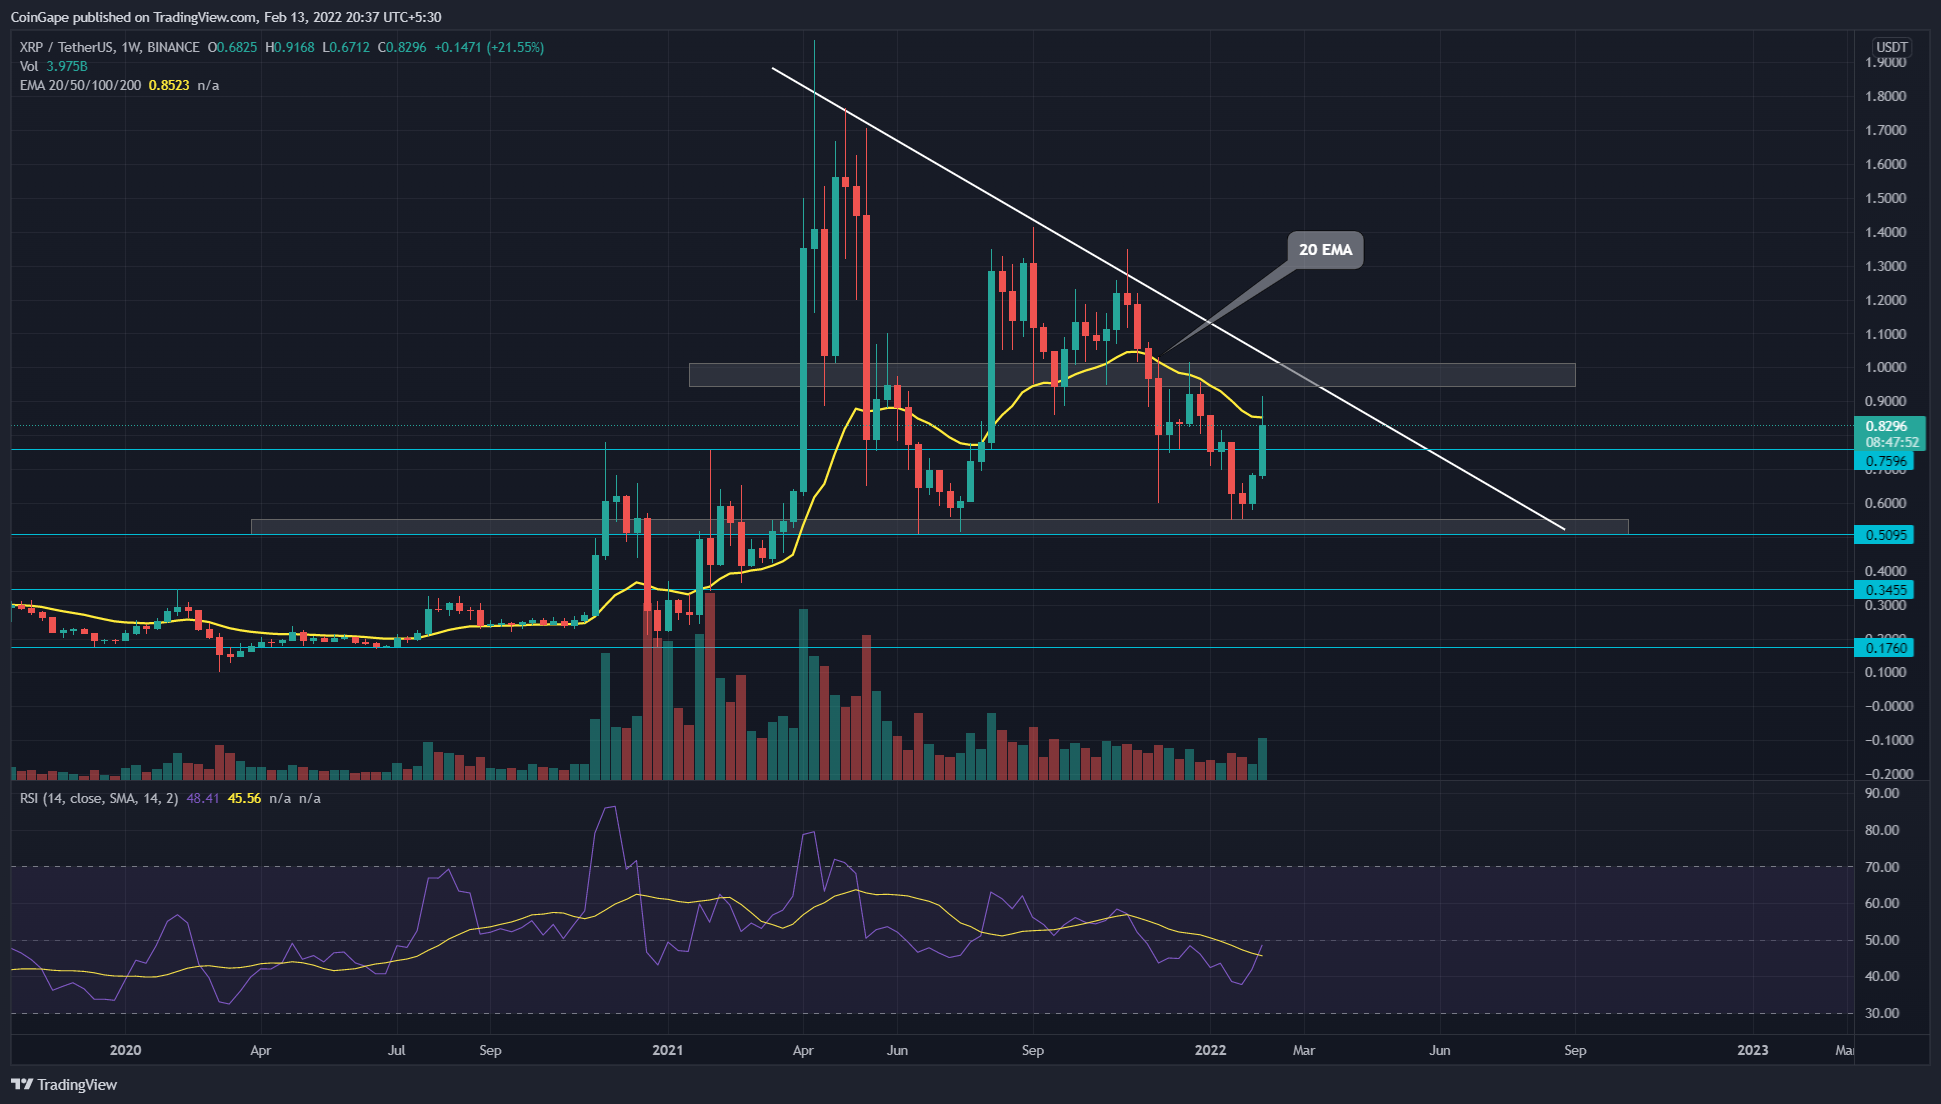
The XRP price displayed an impressive recovery last week, rallying to the $0.9 mark. However, the sellers mounted stiff resistance at the confluence of 200-day EMA and the rising trendline, pulling the altcoin back to $0.75 support. Under the influence of a descending triangle pattern, the sellers could lead the XRP price to $0.5.
Key technical points:
- The 200-day EMA imposing strong resistance on XRP price.
- The intraday trading volume in the XRP is $3.1 Billion, indicating a 0.4% hike.
 Source- Tradingview
On January 5th, the XRP price plunged below the crucial support trendline that had carried the bullish trend for more than a year. The technical chart indicates the recent price recovery was a retest phase and the long wicks on the flipped resistance threaten the downtrend resumption.
The XRP price chart also shows the path to least resistance is downward, where the sellers could sink the altcoin to the $0.5 mark once they poked the $0.75 support.
However, on the upside, the buyers will have to make strong efforts to surpass the resistance and psychological level of $1 and 200-day EMA.
Descending Triangle Stands As Governing Pattern In XRP Price
 Source- Tradingview
As mentioned in our previous article, the XRP price resonates within the descending triangle pattern in the weekly chart. The Ripple prices continue their approach to the resistance trendline with a 50% growth in the past week. However, a higher price rejection at the weekly-20 EMA suggests profit booking from long buyers.
The 20-period EMA in the weekly chart opposes the bullish growth for the second time. However, closing above the average line could lead XRP to the overhead descending trendline.
As for the RSI indicator, the slope rises above the 14-period average in the weekly chart, reflecting growth in the underlying bullishness.
- Resistance level: $1 and $1.3
- Support levels: $0.75 and $0.5
The post XRP Price Prediction: Will XRP Retest $0.5 Again Or Continue Bull Run Beyond $0.9? appeared first on CoinGape.


