- In the past five days, the year-to-date laggard Dow Jones Industrial Average (DJIA) has played a positive catch-up.
- On a rolling 5-day performance basis, the DJIA has outperformed with a gain of +1.10% over the Nasdaq 100’s loss of -0.70% due to recent softness seen in the share price of Nvidia.
- Watch the key short-term support of 38,930.
Aceasta este o analiză ulterioară a raportului nostru anterior, “US DJIA Technical: Uptrend intact with looming outperformance over Nasdaq 100” publicat pe 3 ianuarie 2024. Faceți clic aici pentru o recapitulare.
On a year-to-date performance basis as of 13 March 2024, the Nasdaq 100 has managed to record a gain of 8.3% that surpassed the return of the Dow Jones Industrial Average of +3.50%.
Interestingly, in the past five days (5-day rolling basis as of 13 March), the laggard Dow Jones Industrial Average has started to play a catch-with with a return of +1.10% that overtook the Nasdaq 100’s loss of -0.70%.
The primary attribution to the current short-term outperformance of the Dow Jones Industrial Average over the Nasdaq 100 has been the lacklustre performance of the Artificial Intelligence (AI) theme play leader, Nvidia (third largest component market cap weightage stock in Nasdaq 100) where its share price has shed -5.6% over the same period.
Potential major bullish basing condition in ratio chart of DJIA/NDX
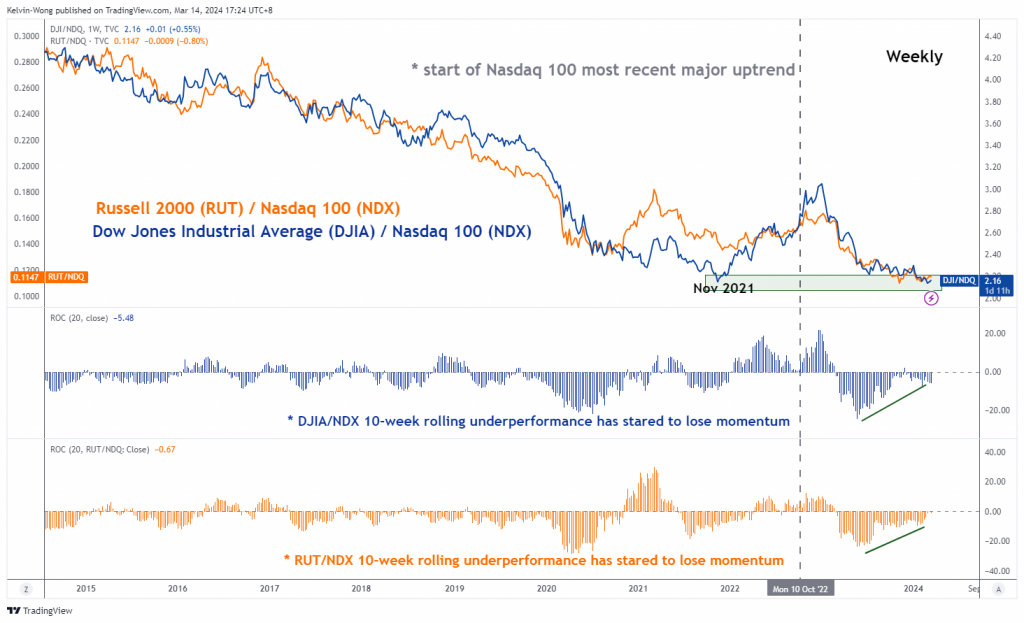
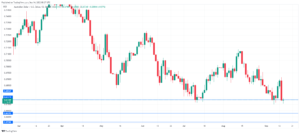
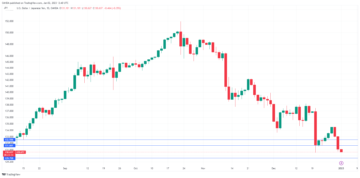
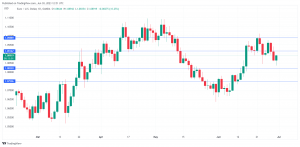
Fig 1: Ratio charts of DJIA & Russell 200 over Nasdaq 100 as of 14 Mar 2024 (Source: TradingView, click to enlarge chart)
The ratio chart of the Dow Jones Industrial Average (DJIA) over the Nasdaq 100 has started to form a potential major basing formation by not breaking below its prior significant November 2021 swing low (see Fig 1).
Also, its 10-week rolling underperformance measured by the ratio’s rate of change has continued to display a bullish divergence condition which suggests a potential looming major outperformance of DJIA over the Nasdaq 100.
Price actions cleared above 20-day moving average
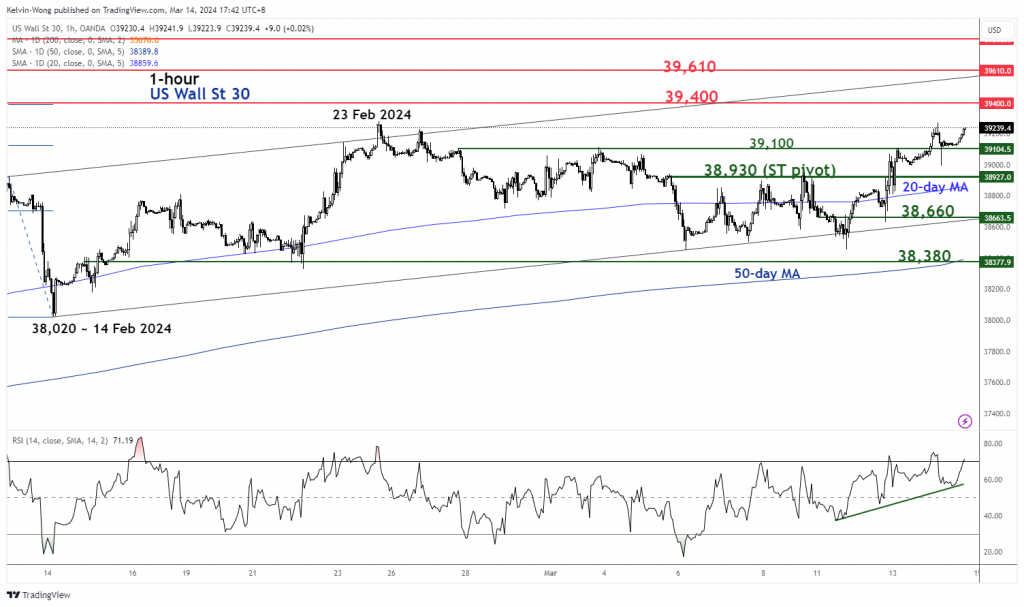
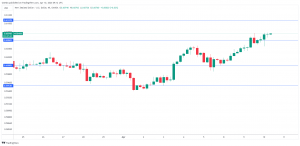
Fig 2: US Wall St 30 short-term trend as of 14 Mar 2024 (Source: TradingView, click to enlarge chart)
Yesterday, 13 March’s price actions movement of the US Wall St 30 Index (a proxy of the Dow Jones Industrial Average futures) staged a bullish breakout from its prior choppy minor range configuration in place since 23 February (see Fig 2).
In addition, the Index has also surpassed the 20-day moving average which suggests the potential revival of bullish momentum at least in the near-term horizon.
If the 38,930 short-term pivotal support holds, the Index may continue to shape “higher highs” for the next intermediate resistances to come in at 39,400 and 39,610 (also the upper boundary of the minor ascending channel from 14 February 2024 low).
On the flip side, a break below 38,930 negates the bullish tone for another round of choppy minor corrective decline that may expose the next intermediate supports at 38,660 and 38,380 (also the upward-sloping 50-day moving average).
Conținutul are doar scop informativ general. Nu este un sfat de investiții sau o soluție de cumpărare sau vânzare de valori mobiliare. Opiniile sunt autorii; nu neapărat cel al OANDA Business Information & Services, Inc. sau al oricăruia dintre afiliații, filialele, funcționarii sau directorii săi. Dacă doriți să reproduceți sau să redistribuiți orice conținut găsit pe MarketPulse, un serviciu premiat de analiză valutară, mărfuri și indici globali și site de știri, produs de OANDA Business Information & Services, Inc., vă rugăm să accesați fluxul RSS sau să ne contactați la info@marketpulse.com. Vizita https://www.marketpulse.com/ pentru a afla mai multe despre ritmul piețelor globale. © 2023 OANDA Business Information & Services Inc.
- Distribuție de conținut bazat pe SEO și PR. Amplifică-te astăzi.
- PlatoData.Network Vertical Generative Ai. Împuterniciți-vă. Accesați Aici.
- PlatoAiStream. Web3 Intelligence. Cunoștințe amplificate. Accesați Aici.
- PlatoESG. carbon, CleanTech, Energie, Mediu inconjurator, Solar, Managementul deșeurilor. Accesați Aici.
- PlatoHealth. Biotehnologie și Inteligență pentru studii clinice. Accesați Aici.
- Sursa: https://www.marketpulse.com/indices/us-djia-technical-bullish-breakout-ahoy/kwong
- :are
- :este
- :nu
- :Unde
- 1
- 100
- 13
- 14
- ani 15
- 15%
- 200
- 2021
- 2023
- 2024
- 23
- 30
- 39
- 400
- 610
- 7
- 700
- 8
- a
- Despre Noi
- mai sus
- acces
- acțiuni
- plus
- sfat
- afiliate
- AI
- de asemenea
- an
- analize
- analiză
- și
- O alta
- Orice
- SUNT
- în jurul
- artificial
- inteligență artificială
- Inteligența artificială (AI)
- AS
- At
- autor
- Autorii
- Avatar
- in medie
- acordare
- bază
- bate
- fost
- de mai jos
- graniţă
- Cutie
- Pauză
- Breaking
- Breakout
- Bullish
- divergență bullish
- afaceri
- cumpăra
- by
- capac
- Schimbare
- Canal
- Diagramă
- Grafice
- clic
- COM
- combinaţie
- cum
- Mărfuri
- component
- condiție
- efectuat
- Configuraţie
- Conectarea
- contactați-ne
- conţinut
- continua
- a continuat
- cursuri
- Curent
- Zi
- Refuzați
- Directorii
- Afişa
- Divergență
- jia
- dow
- Dow Jones
- Dow Jones Industrial Average
- două
- Elliott
- mări
- schimb
- experienţă
- expert
- februarie
- smochin
- financiar
- Găsi
- cinci
- Flip
- debit
- Pentru
- străin
- devize
- Forex
- formă
- formare
- găsit
- din
- fond
- fundamental
- Futures
- Câştig
- General
- Caritate
- piețele globale
- deține
- orizont
- HTTPS
- if
- in
- Inc
- index
- Indici
- industrial
- informații
- Inteligență
- investiţie
- IT
- ESTE
- ianuarie
- jones
- Kelvin
- Cheie
- cea mai mare
- Nume
- lider
- cel mai puțin
- nivelurile de
- ca
- profilează
- de pe
- Jos
- Macro
- major
- gestionate
- strica
- Martie
- Martie 2024
- Piață
- Capul pieței
- perspective de piață
- de cercetare de piață
- MarketPulse
- pieţe
- max-width
- Mai..
- minor
- Impuls
- mai mult
- mişcare
- în mişcare
- media mobilă
- Nasdaq
- Nasdaq 100
- în mod necesar
- ştiri
- următor
- noiembrie
- Noiembrie 2021
- numeroși
- Nvidia
- of
- ofițerii
- on
- afară
- Avize
- or
- al nostru
- afară
- Perspectivă
- depășit
- peste
- pasionat
- trecut
- performanță
- perioadă
- perspective
- pivot
- Loc
- Plato
- Informații despre date Platon
- PlatoData
- Joaca
- a jucat
- "vă rog"
- poziţionare
- pozitiv
- postări
- potenţial
- preţ
- primar
- anterior
- Produs
- furnizarea
- împuternicit
- publicat
- scopuri
- gamă
- rată
- raport
- recapitula
- recent
- record
- raportează
- cercetare
- cu amănuntul
- reveni
- Inversare
- Rulare
- rotund
- RSS
- acelaşi
- Titluri de valoare
- vedea
- văzut
- vinde
- senior
- serviciu
- Servicii
- Modela
- Distribuie
- partajarea
- vărsa
- Pe termen scurt
- parte
- semnificativ
- întrucât
- Singapore
- teren
- soluţie
- Sursă
- specializata
- început
- stoc
- Piețele de acțiuni
- Strateg
- sugerează
- a sustine
- Sprijină
- depășit
- Leagăn
- Tehnic
- Analiza Tehnica
- zece
- acea
- temă
- Al treilea
- mii
- la
- TONE
- Comercianti
- Trading
- TradingView
- Pregătire
- tendință
- unic
- trend ascendent
- us
- folosind
- v1
- Vizita
- Perete
- Val
- BINE
- care
- câștigător
- cu
- wong
- ar
- ani
- Tu
- zephyrnet

