- Recent China’s stimulus policies have failed to provide a positive feedback loop for AUD/USD bulls.
- The recent movement of the AUD/USD seems to be more driven by the fixed income yield spread between the 2-year US Treasury note and the Australian government bond.
- The pushback in expectations of the first Fed funds rate cut has put downside pressure on the 2-year negative yield spread between the Australian government bond and the US Treasury note.
- Watch the 0.6570 key short-term resistance for the AUD/USD.
To je nadaljnja analiza našega prejšnjega poročila, “AUD/USD Technical: Potential short-term bullish reversal for AUD supported by China’s stock market rescue package” objavljeno 23. januarja 2024. Kliknite tukaj za povzetek.
Since our last analysis, the price actions of the AUD/USD have failed to rally despite being a traditional risk-on proxy currency pair that tends to be supported by stimulus policies enacted by China.
Before the Lunar New Year break, the Chinese central bank, PBoC issued an advance notice on 24 January that major commercial banks’ reserve ratio requirement would be cut by 50 basis points (bps) that took effect on 5 February which translated to an additional 1 trillion yuan in long-term capital to negate the persistent weakness in the property sector as banks now have more capital to provide loans.
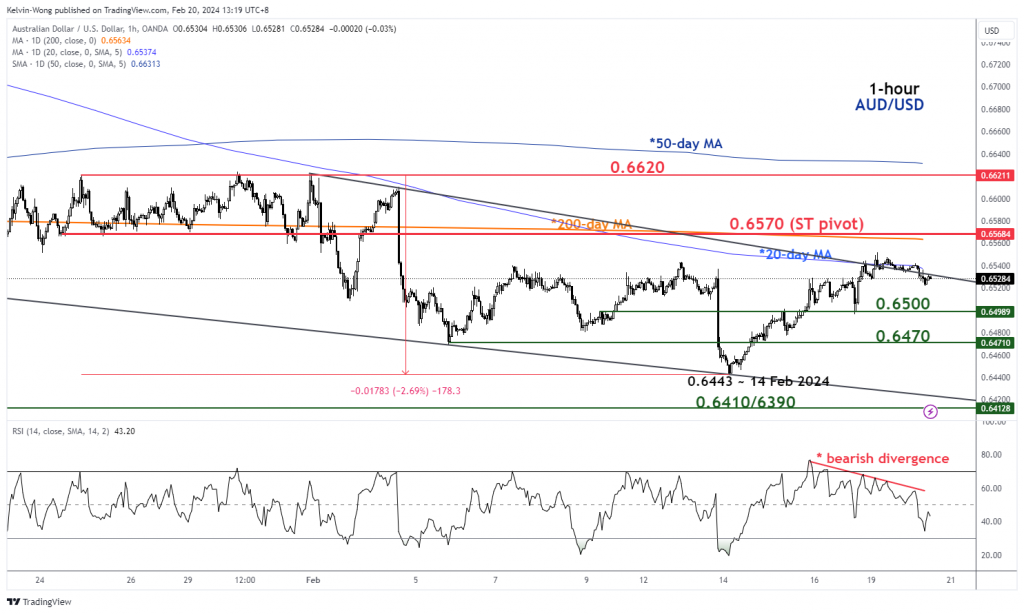
The AUD/USD did not react positively but in contrast, declined by -178 pips (-2.7%) from its 24 January high of 0.6621 to a recent 14 February low of 0.6443.
No positive reaction from AUD/USD despite more stimulus policies from China
In addition, today’s more-than-expected 25 bps cut (the consensus view was a 15 bps cut) on China’s 5-year loan prime rate, the benchmark for mortgage rates to 3.95%. This latest cut is the largest since 2019 but has failed to provide a positive feedback loop for the AUD/USD where it shed by -0.14% on an intraday basis at this time of the writing.
Based on an intermarket perspective, it seems that the ongoing weakness in AUD/USD is likely to be primarily driven now by the timing and pace of the US Federal Reserve’s highly anticipated interest rate cut cycle initiation in 2024 which in turn impacts the fixed income yield spread between the 2-year US Treasury note and Australia government bond.
The hotter-than-expected US CPI print for January has pushed back the expectations of the first Fed rate cut to June from March (priced at the start of the year based on the CME FedWatch Tool) and reduced the number of expected cuts from six (at the start of the year) to four before 2024 ends.
A widening of the yield discount between 2-year Australian government bond over US Treasury note has put downside pressure on the AUD/USD
A less dovish Fed has put downside pressure on the 2-year negative yield spread between the Australian government bond and the US Treasury note where the spread has declined by -50 bps from 15 January to 19 February, making the Australian government bond less attractive to the US Treasury note, in turn capping AUD/USD’s potential upside movement.
Bearish breakdown from “Head & Shoulders”
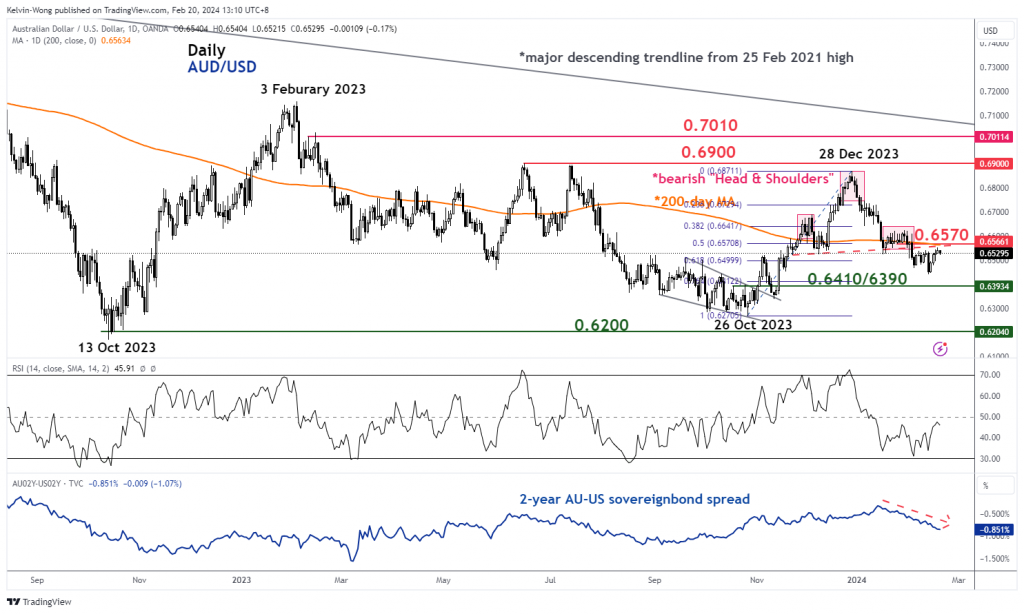
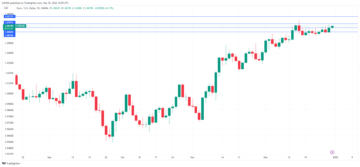
Fig 1: AUD/USD medium-term trend as of 20 Feb 2024 (Source: TradingView, click to enlarge chart)
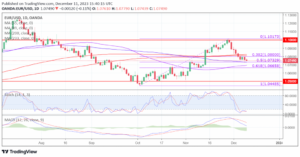
Fig 2: AUD/USD short-term trend as of 20 Feb 2024 (Source: TradingView, click to enlarge chart)
Also, through the lens of technical analysis, the AUD/USD has staged a bearish breakdown from a medium-term bearish “Head & Shoulders” reversal configuration on 2 February and its former neckline support of 0.6570 has now turned into a pull-back resistance that also confluence with the 200-day moving average (see daily chart).
In the short term, last week’s push-up from the 14 February low of 0.6443 to the 19 February high of 0.6552 has started to show signs of exhaustion. The price actions have failed to make a clear breakout above a minor descending trendline resistance from the 31 January high and at the same time, the hourly RSI momentum indicator has flashed out a bearish divergence condition at its overbought region (see 1-hour chart)
Watch the 0.6570 key short-term pivotal resistance for the risk of a potential decline to expose the near-term supports of 0.6500/6470. Failure to hold at 0.6470 may see further weakness for the medium-term support to come in at 0.6410/6390 (also the 76.4% Fibonacci retracement of the prior upmove from 26 October 2023 low to 28 December 2023 high).
On the flip side, a clearance above 0.6570 negates the bearish tone for the next intermediate resistance to come in at 0.6620 (also the downward-sloping 50-day moving average).
Vsebina je samo za splošne informacije. To ni naložbeni nasvet ali rešitev za nakup ali prodajo vrednostnih papirjev. Mnenja so avtorji; ne nujno družbe OANDA Business Information & Services, Inc. ali katere koli njene podružnice, hčerinske družbe, uradnikov ali direktorjev. Če želite reproducirati ali ponovno distribuirati katero koli vsebino, ki jo najdete na MarketPulse, nagrajeni storitvi spletnega mesta z novicami in analizami forexa, blaga in globalnih indeksov, ki jo proizvaja OANDA Business Information & Services, Inc., dostopajte do vira RSS ali nas kontaktirajte na info@marketpulse.com. Obiščite https://www.marketpulse.com/ izvedeti več o utripu svetovnih trgov. © 2023 OANDA Business Information & Services Inc.
- Distribucija vsebine in PR s pomočjo SEO. Okrepite se še danes.
- PlatoData.Network Vertical Generative Ai. Opolnomočite se. Dostopite tukaj.
- PlatoAiStream. Web3 Intelligence. Razširjeno znanje. Dostopite tukaj.
- PlatoESG. Ogljik, CleanTech, Energija, Okolje, sončna energija, Ravnanje z odpadki. Dostopite tukaj.
- PlatoHealth. Obveščanje o biotehnologiji in kliničnih preskušanjih. Dostopite tukaj.
- vir: https://www.marketpulse.com/forex/aud-usd-technical-bulls-have-failed-to-break-above-the-0-6570-resistance/kwong
- :ima
- : je
- :ne
- :kje
- 1
- 14
- 15 let
- 15%
- 19
- 20
- 2019
- 2023
- 2024
- 23
- 24
- 25
- 26%
- 28
- 31
- 420
- 50
- 7
- 700
- 95%
- a
- O meni
- nad
- dostop
- dejavnosti
- Poleg tega
- Dodatne
- napredovanje
- nasveti
- podružnice
- Prav tako
- an
- Analize
- Analiza
- in
- Predvideno
- kaj
- SE
- okoli
- AS
- At
- privlačen
- AUD
- AUD / USD
- Avstralija
- avstralski
- Avtor
- Avtorji
- avatar
- povprečno
- Nagrada
- nazaj
- Banka
- Banke
- temeljijo
- Osnova
- BE
- Medvjedast
- razhajanje medvedov
- premagati
- pred
- počutje
- spodaj
- merilo
- med
- obveznic
- Pasovi
- Break
- Razčlenitev
- zlom
- Bikovski
- Biki
- poslovni
- vendar
- nakup
- by
- Kapital
- Osrednji
- Centralna banka
- Graf
- Kitajska
- Kitajci
- kitajski
- jasno
- Potrditev
- klik
- CM razširitev
- COM
- kombinacija
- kako
- komercialna
- Blago
- stanje
- poteka
- konfiguracija
- sotočje
- Povezovanje
- Soglasje
- kontakt
- vsebina
- kontrast
- tečaji
- CPI
- valuta
- Cut
- kosi
- cikel
- vsak dan
- december
- Zavrni
- Kljub
- DID
- Direktorji
- Popust
- Razhajanja
- Dovish
- slaba stran
- vozi
- učinek
- Elliott
- konča
- Povečaj
- Izmenjava
- pričakovanja
- Pričakuje
- izkušnje
- strokovnjak
- ni uspelo
- Napaka
- februar
- februar
- Fed
- stopnja krme
- Zvezna
- Zvezne rezerve
- povratne informacije
- Fibonaccijevo
- finančna
- Najdi
- prva
- Všita
- stalni prihodek
- Flip
- Pretok
- za
- tuji
- devizni
- forex
- Nekdanji
- je pokazala,
- štiri
- iz
- Sklad
- temeljna
- Skladi
- nadalje
- splošno
- Globalno
- svetovnih trgih
- vlada
- Imajo
- visoka
- zelo
- držite
- HTTPS
- if
- Vplivi
- in
- Inc
- prihodki
- Kazalec
- indeksi
- Podatki
- Začetek
- obresti
- OBRESTNA MERA
- v
- naložbe
- Izdala
- IT
- ITS
- januar
- junij
- Kelvin
- Ključne
- Največji
- Zadnja
- Zadnji
- objektiv
- manj
- ravni
- kot
- Verjeten
- posojila
- Posojila
- dolgoročna
- nizka
- Lunar
- Makro
- velika
- Znamka
- Izdelava
- marec
- Tržna
- tržni obeti
- tržna raziskava
- MarketPulse
- Prisotnost
- max širine
- Maj ..
- mladoletnika
- Momentum
- več
- Hipotekarni
- Gibanje
- premikanje
- drseče povprečje
- nujno
- negativna
- Novo
- novo leto
- novice
- Naslednja
- Upoštevajte
- Opaziti..
- zdaj
- Številka
- številne
- oktober
- of
- uradniki
- on
- v teku
- samo
- Komentarji
- or
- naši
- ven
- Outlook
- več
- Pace
- par
- strastno
- PBOC
- perspektiva
- perspektive
- fotografija
- ključno
- platon
- Platonova podatkovna inteligenca
- PlatoData
- prosim
- točke
- politike
- pozicioniranje
- pozitiven
- pozitivno
- Prispevkov
- potencial
- tlak
- Cena
- v prvi vrsti
- Predsednik
- Tiskanje
- Predhodna
- Proizvedeno
- nepremičnine
- zagotavljajo
- zagotavljanje
- proxy
- namene
- potisnilo
- dal
- rally
- Oceniti
- Cene
- razmerje
- Reagirajo
- reakcija
- Rekapitulacija
- nedavno
- Zmanjšana
- okolica
- poročilo
- zahteva
- reševanje
- Raziskave
- Reserve
- Odpornost
- Trgovina na drobno
- . \ t
- Razveljavitev
- Tveganje
- RSI
- rss
- Enako
- sektor
- Vrednostni papirji
- glej
- Zdi se,
- prodaja
- višji
- Storitev
- Storitve
- delitev
- shed
- Kratke Hlače
- kratkoročno
- Prikaži
- strani
- Znaki
- saj
- Singapur
- spletna stran
- SIX
- Rešitev
- vir
- specializacijo
- namaz
- Začetek
- začel
- dražljaj
- zaloge
- borza
- Borzni trgi
- Strategist
- podpora
- Podprti
- Podpira
- tehnični
- Tehnična analiza
- deset
- težava
- Izraz
- da
- O
- ta
- tisoče
- skozi
- čas
- čas
- do
- današnje
- TONE
- vzel
- orodje
- trgovci
- Trgovanje
- TradingView
- tradicionalna
- usposabljanje
- zakladnica
- Trend
- Bilijona
- OBRAT
- Obrnjen
- edinstven
- Upside
- us
- CPI v ZDA
- ameriška zvezna
- Ministrstvo za finance ZDA
- uporabo
- v1
- Poglej
- obisk
- je
- Wave
- šibkost
- Dobro
- ki
- zmago
- z
- Wong
- bi
- pisanje
- leto
- let
- donos
- Vi
- Yuan
- zefirnet

