SNEAK PEEK:
- ANKR bulls’ efforts propel the price to a remarkable 90-day high.
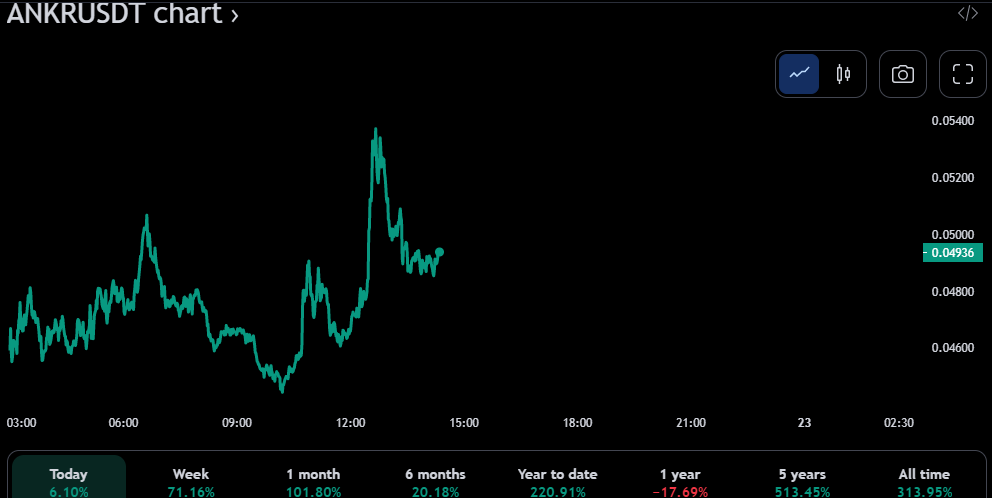
- ANKR’s price has fluctuated between $0.03299 and $0.05474 in the previous 24 hours.
- The RSI and MFI warn traders that the market is overbought.
Ankr (ANKR) has shown bullish strength in the past day, as the price has risen to a new 90-day high of $0.05474. On the upswing, the market found support around $0.03298 and the bears’ efforts to take the market were unsuccessful. At the time of writing, the bulls had won, and a valuation of $0.04872 had been assigned to ANKR, representing a rise of 46.73 %.
Traders’ expectations for a protracted bull market rise drove them to enter the market, causing a 46.70% and 1953.32% increase in market capitalization and 24-hour trading volume, respectively, to $470,881,064 and $1,464,019,538. The recent uptick in Ankr’s (ANKR) trading volume and market capitalization might be seen as a sign that investors and traders are feeling more optimistic about the future of Ankr.

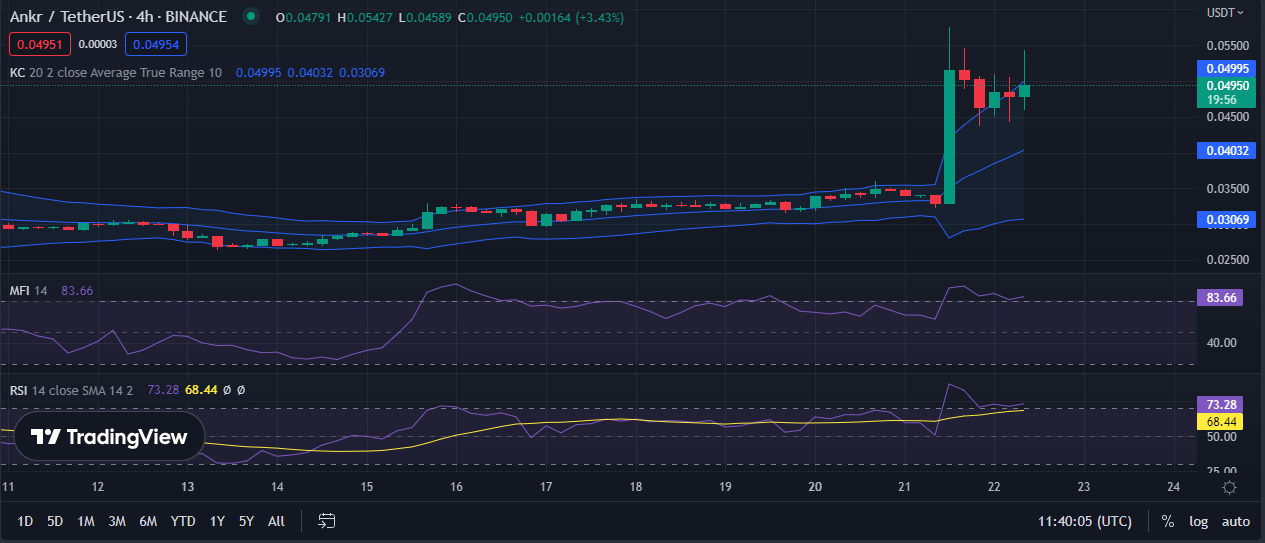
On the ANKR 4-hour price, the Keltner Channel bands are bulging and heading north, with the top bar at 0.04987 and the bottom band at 0.03061. This bulge suggests a robust optimistic mood in the ANKR market, with prices expected to rise soon as traders ride the present rally.
In addition, a green candlestick’s upward price movement and development show that traders are willing to purchase ANKR as a possible indicator of market bullishness.
The Money Flow Index (MFI) now reads 83.59, showing that the present bullish momentum is robust and has been increasing over the previous 4 hours, indicating a significant amount of bullish purchasing pressure.
The significant volume of ANKR bolsters this move during this period, indicating that traders are keen to capitalize on this market opportunity. Nevertheless, since the MFI is overbought at 83.59, the price may reverse or stall as buyers become more cautious.
The Relative Strength Index (RSI) is now trending above its signal line and has settled at 72.54, suggesting that ANKR is overbought and traders should be aware of any possible price reversal. Despite the strong MFI and RSI readings, traders should be careful and mindful that a reversal of market momentum is probable.

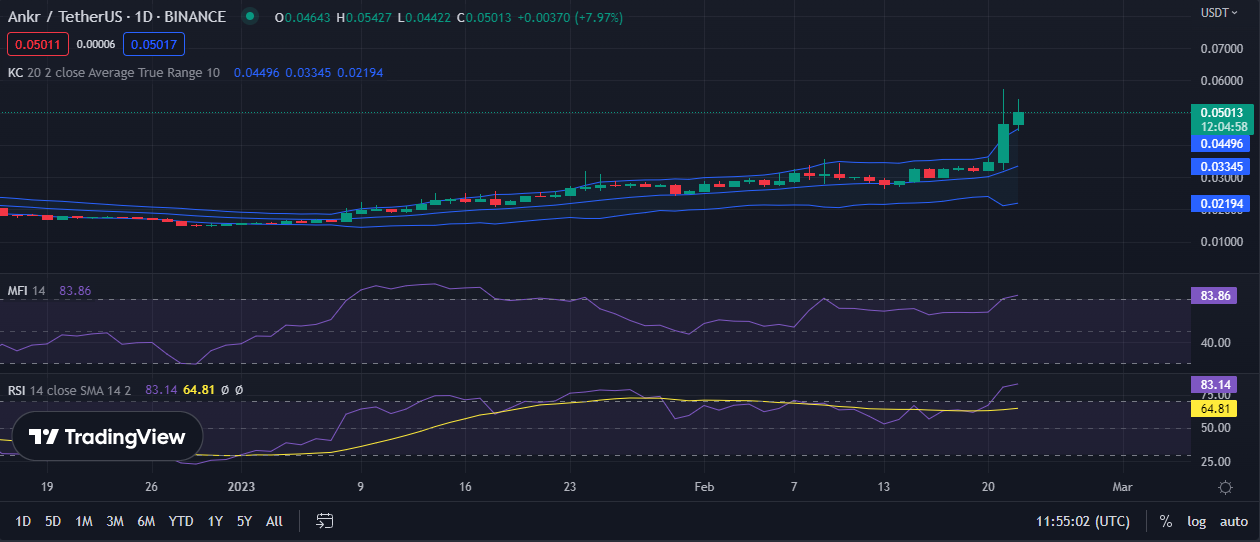
The Keltner bands on the 24-hour ANKR price chart are also bulging, with the top bar at 0.04492 and the bottom at 0.02189. The bulging Keltner bands suggest that the ANKR price is volatile and rapidly climbing. Because the price action has moved above the upper band, the present bullish momentum may continue, and the ANKR price might rise.
While the MFI indicates that the market is overbought with a reading of 83.83 and the RSI has a value of 82.78, traders should exercise caution because ANKR is now overpriced. This cautionary tale is because the market may soon hit over-exhaustion, resulting in a dramatic decline in the ANKR price.

Although optimistic, signs suggest that a reversal is possible in the short future since the ANKR market is overbought.
Disclaimer: In good faith, we disclose our thoughts and opinions in our price analysis, as well as all the facts we give. Each reader is responsible for his or her own investigation. Reader discretion is advised before taking any action.
- SEO Powered Content & PR Distribution. Get Amplified Today.
- Platoblockchain. Web3 Metaverse Intelligence. Knowledge Amplified. Access Here.
- Source: https://investorbites.com/ankr-price-analysis-22-2/
- a
- About
- above
- Achieve
- Action
- addition
- All
- amount
- analysis
- and
- Ankr
- around
- assigned
- BAND
- bar
- because
- become
- before
- between
- Bottom
- bull
- Bull Market
- Bullish
- Bulls
- buyers
- capitalization
- capitalize
- careful
- causing
- cautious
- Channel
- Chart
- Climbing
- continue
- day
- Decline
- Despite
- Development
- Disclose
- discretion
- dramatic
- during
- each
- efforts
- endeavors
- Enter
- Exercise
- expectations
- expected
- flow
- fluctuated
- found
- future
- Give
- good
- Green
- Heading
- High
- Hit
- HOURS
- HTTPS
- important
- in
- Increase
- increasing
- index
- indicates
- Indicator
- internal
- investigation
- Investors
- Keen
- Line
- Market
- Market Capitalization
- Market News
- might
- Momentum
- money
- more
- move
- movement
- Nevertheless
- New
- news
- North
- Opinions
- Opportunity
- Optimistic
- own
- past
- Peak
- period
- plato
- Plato Data Intelligence
- PlatoData
- possible
- present
- pressure
- previous
- price
- PRICE ACTION
- Price Analysis
- price chart
- Prices
- Propel
- purchase
- purchasing
- rally
- rapidly
- Reader
- Reading
- recent
- relative strength index
- remarkable
- representing
- responsible
- resulting
- Revealed
- Reversal
- reverse
- Ride
- Rise
- Risen
- robust
- rsi
- Settled
- Short
- should
- show
- shown
- sign
- Signal
- significant
- Signs
- since
- Source
- stablecoin
- strength
- strong
- Suggests
- support
- Take
- taking
- The
- time
- to
- top
- Traders
- Trading
- trading volume
- TradingView
- trending
- upward
- Valuation
- value
- volatile
- volume
- What
- What is
- willing
- Won
- writing
- zephyrnet


