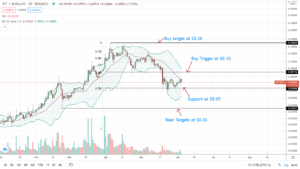
Ankr Web 3.0 is a PoS-based blockchain platform that supports the creation of decentralized apps across multiple blockchains. It also provides turnkey enterprise solutions for crypto exchanges, data analytics providers, etc. ANKR is the native token of this ecosystem and the technical analysis is as follows:
Past Performance
On May 10, 2021, ANKR opened at $0.16. On May 16, 2021, ANKR closed at $0.14. Thus, in the past week, the ANKR price has decreased by approximately 12%. In the last 24 hours, ANKR has traded between $0.126-$0.141.

Day-Ahead and Tomorrow
Currently, ANKR is trading at $0.13. The price has decreased from the day’s opening price of $0.14. Thus, the market seems to be bearish.
The MACD and signal lines are negative. Moreover, a bearish crossover by the MACD line over the signal line has occurred. Thus, the overall market momentum is bearish. Hence, the price may decline further.
Currently, the RSI indicator is at 48%. It just rallied from the ‘oversold’ region and faced rejection at 52% and fell again. Thus, selling pressures are high. In other words, like the MACD indicator, the RSI indicator is also pointing towards a price dip.
The A/D indicator has fallen steeply. Thus, whale distributions are higher than whale accumulations. However, the A/D indicator has started rising steadily implying that accumulation activity is gradually mounting.
In short, when we look at all three oscillators together, we can say that as of now, the bears are strong and the price will continue to fall. Thereafter, we have to wait and watch if a trend reversal occurs.
ANKR Technical Analysis
Currently, the price is below the first Fibonacci pivot support level of $0.13. The price may soon fall below the subsequent support levels of $0.126 and $0.12, respectively. Thereafter, we have to wait and watch to see if the price starts rising.
Presently, the price has fallen below a 23.6% FIB retracement level of $0.129. Hence, if by the day end, the price does not retest and break out of this level, then the price downtrend is strong enough to sustain till tomorrow.
- "
- active
- All
- analysis
- analytics
- apps
- bearish
- Bears
- blockchain
- border
- closed
- continue
- data
- Data Analytics
- day
- decentralized
- digital
- employees
- Enterprise
- Figure
- High
- HTTPS
- IT
- Level
- Line
- Market
- Momentum
- Other
- Pivot
- platform
- PoS
- Posts
- price
- Short
- Solutions
- started
- support
- support level
- Supports
- Technical
- Technical Analysis
- token
- Trading
- visa
- wait
- Watch
- web
- week
- words


