SNEAK PEEK
- AVAX bulls drive prices higher amidst positive sentiment, signaling market recovery.
- Increased demand fuels AVAX’s price rise, attracting traders and investors.
- A solid trend on the AVAX chart offers entry and exit positions for profitable trades.
Despite bears’ attempt to dominate the Avalanche (AVAX) market at an intraday low of $11.28, bulls gained strength and drove prices to an intraday high of $11.81, marking a significant recovery. This price surge could be attributed to the overall positive sentiment in the AVAX market.
At the time of writing, the price of AVAX had risen by 2.10% to $11.70 due to the ongoing bullish trend. This price increase is likely the result of greater demand from investors and traders trying to take advantage of the current market conditions.
The 24-hour trading volume for AVAX decreased by 2.73% to $103,218,483, while the market capitalization increased by 2.16% to $4,036,223,213. Although the rise in market capitalization might point to a positive trend for AVAX, the fall in trading volume might signify investors’ lack of interest or confidence.
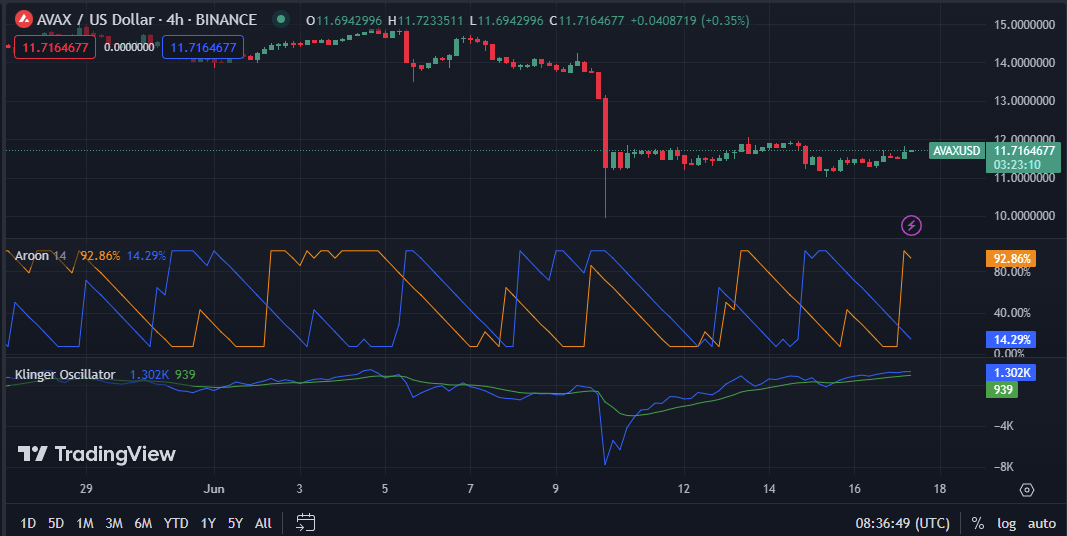
According to the Klinger Oscillator, which has a reading of 1.302k and is moving above its signal line, the market is experiencing an increase in bullish momentum. Investors may consider liquidating current long positions or establishing new ones if the Klinger Oscillator’s line crosses below the signal line, regarded as a sell signal.
On the AVAX 4-hour price chart, the Aroon up and down values are 92.86% and 14.29%, respectively. This movement shows that the trend is solid and might last for a while, despite the possibility of brief reversals, enabling traders to identify potential entry and exit points for trades.

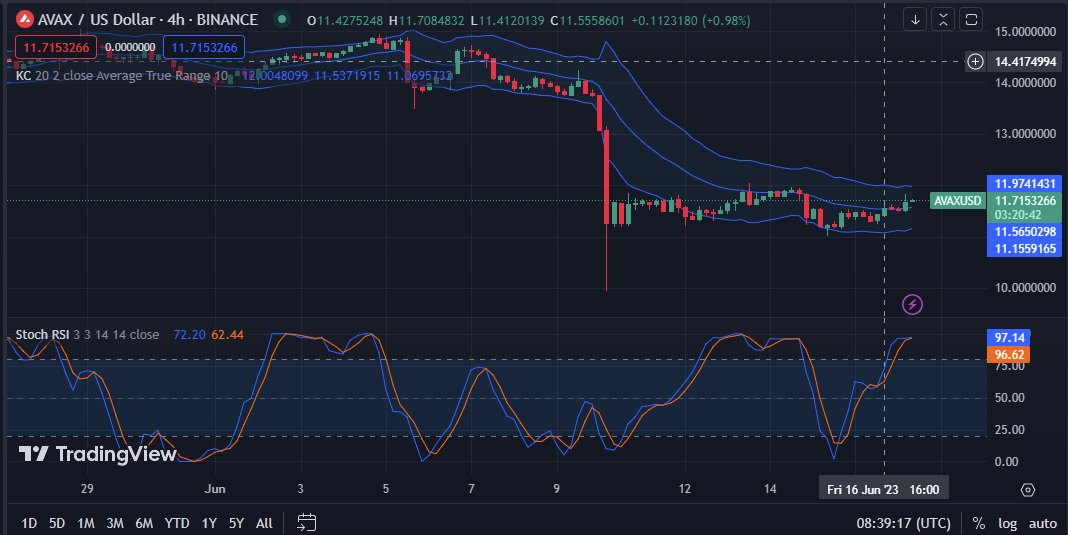
The upper and lower readings of the Keltner Channel bands are 11.9742564 and 11.5651234, respectively, on the 4-hour price chart for AVAX, indicating a bullish trend. Traders should consider buying AVAX at the present levels with a sell target price close to the upper Keltner Channel.
Green candlesticks are forming on the AVAX price chart, and price action is moving along the middle band, supporting the bullish momentum. To reduce risk, traders should be aware of potential resistance levels and use stop losses if the bull’s strength wanes.
AVAX’s 4-hour price chart’s Stochastic RSI value of 97.14 and movement above its signal line indicate bullish market momentum. This motion implies that buyers are in control of the market and that AVAX’s price can rise further.

In conclusion, as AVAX experiences a bullish recovery, traders and investors should seize the potential opportunities in the market, leveraging positive sentiment and identifying entry and exit points for profitable trades.
Disclaimer: Cryptocurrency price is highly speculative and volatile and should not be considered financial advice. Past and current performance is not indicative of future results. Always research and consult with a financial advisor before making investment decisions.
- SEO Powered Content & PR Distribution. Get Amplified Today.
- EVM Finance. Unified Interface for Decentralized Finance. Access Here.
- Quantum Media Group. IR/PR Amplified. Access Here.
- PlatoAiStream. Web3 Data Intelligence. Knowledge Amplified. Access Here.
- Source: https://investorbites.com/avalanche-avax-price-analysis-17-06/
- :has
- :is
- :not
- $UP
- 1
- 11
- 14
- 22
- 28
- 70
- a
- above
- Action
- ADvantage
- advice
- advisor
- along
- Although
- always
- Amid
- amidst
- an
- analysis
- and
- ARE
- AS
- At
- attracting
- Avalanche
- Avalanche price
- Avalanche price analysis
- AVAX
- AVAX Price
- AVAX/USD
- aware
- BAND
- BE
- before
- below
- Bullish
- Bulls
- buyers
- Buying
- by
- CAN
- candlesticks
- capitalization
- Channel
- Chart
- Close
- conclusion
- conditions
- confidence
- Consider
- considered
- control
- could
- Current
- decisions
- Demand
- Despite
- Dominate
- down
- drive
- due
- enabling
- entry
- establishing
- Exit
- Experiences
- experiencing
- Fall
- financial
- financial advice
- For
- from
- fuels
- further
- future
- gained
- greater
- had
- High
- higher
- highly
- HTTPS
- identify
- identifying
- if
- Ignite
- in
- Increase
- increased
- indicate
- interest
- internal
- investment
- investor
- Investors
- ITS
- Lack
- Last
- levels
- leveraging
- likely
- Line
- Long
- losses
- Low
- lower
- Making
- Market
- Market Capitalization
- market conditions
- Market News
- marking
- May..
- Middle
- might
- Momentum
- motion
- movement
- moving
- New
- news
- of
- Offers
- on
- ones
- ongoing
- opportunities
- or
- overall
- past
- performance
- plato
- Plato Data Intelligence
- PlatoData
- Point
- points
- positions
- positive
- possibility
- potential
- present
- price
- PRICE ACTION
- Price Analysis
- price chart
- Price Increase
- price surge
- Prices
- profitable
- Reading
- recovery
- reduce
- regarded
- research
- Resistance
- respectively
- result
- Results
- Rise
- Risen
- Risk
- rsi
- Seize
- sell
- sentiment
- should
- Shows
- Signal
- significant
- signify
- solid
- Source
- speculative
- Stop
- strength
- Supporting
- surge
- Take
- Target
- that
- The
- this
- time
- to
- Traders
- trades
- Trading
- trading volume
- TradingView
- Trend
- use
- value
- Values
- volatile
- volume
- which
- while
- with
- writing
- zephyrnet


