TL;DR breakdown
- BNB/USD pair was in a head and shoulder pattern yesterday.
- Generally, the Binance coin is trading in a bearish trend.
- Bitcoin and most of the altcoins bleed on the daily cryptocurrency heat map.
Binance coin price analysis: General overview
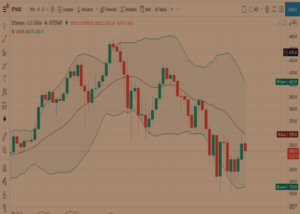
BNB/USD pair was in a head and shoulder pattern yesterday. The coin, nevertheless, closed the 24-hour Binance price analysis chart in a negative trend. The daily price analysis chart started in a bullish market, setting the intraday highs of $466. A few minutes later, sellers came into the market, ready to pull the price downwards.
At the moment, the Power of Balance (POB) was at -0.03, indicating that the bears were extra strong, and at this point, the bulls could not stop the downswing. As per Binance coin price analysis, the sellers pulled the price of the BNB/USD pair downwards in a falling wedge trend.
The Bollinger band was wide in the opening of the daily price analysis. The wideness of the Bollinger band signaled high volatility of the BNB/USD pair. Generally, the Binance coin is trading in a bearish trend. Most of the indicators are negative, suggesting BNB/USD pair might continue falling.
Bitcoin and most altcoins bleed on the daily cryptocurrency heat map.
Source: Coin360
The most prominent virtual asset is trading at $46K, a decline of -0.42 percent. BTC’s closest competitor, ETH, is trading in positive momentum, recording an increment of more than 5 percent on the daily cryptocurrency heat map.
Altcoin, like the meme coin, continues to bleed. This week has been generally bearish to most of the altcoins and the cryptocurrency market in general. Even though some altcoins are trading in a bearish manner, others have recorded massive gains in the last 24 hours; MTL tops the list of gainers with a 66 percent gain. BNBUSD is trading at a loss of -0.4 on the dial cryptocurrency heat map.
Binance coin price movement in the last 24 hours: BNB/USD trading volumes increases
According to our 24-hour candlesticks on the Binance coin price analysis, BNB/USD traded within a moderate daily range of moderate volatility between $466 – $454.
The daily trading volume of Binance coin has recorded a 12 percent increment making the total trading volumes to be $2.3 billion. Binance coin dominance stands at 3.7 percent, while its total market cap is at $6.0 billion. BNB is ranked 4th in the overall market.
BNB/USD 4-hour chart: Bulls gain momentum
On the 4-hour price analysis chart, bulls seem to have outnumbered the bears. Bulls’ comeback seems to be strong enough, and it will lead to a significant surge of the BNB/USD pair.
Source: Tradingview
The RSI indicator is leaning above 50, and it points towards the overbought region, meaning buying pressure is more significant. It is not likely to stop soon as buyers are continually entering the market.
Binance coin Price Analysis: Conclusion
The Binance bull market appears to be unstoppable at the moment. Before the next day’s daily chart begins, the BNB/USD will reach $480.
Disclaimer. The information provided is not trading advice. Cryptopolitan.com holds no liability for any investments made based on the information provided on this page. We strongly recommend independent research and/or consultation with a qualified professional before making any investment decisions.
Source: https://api.follow.it/track-rss-story-click/v3/tHfgumto13BdjDO1NvKRFzErtZyObPkc
- 7
- advice
- Altcoins
- analysis
- asset
- bearish
- Bears
- Billion
- binance
- Binance Coin
- bnb
- Bullish
- Bulls
- Buying
- closed
- Coin
- continue
- continues
- cryptocurrency
- cryptocurrency market
- data
- ETH
- General
- head
- High
- HTTPS
- information
- investment
- Investments
- IT
- lead
- liability
- List
- Making
- map
- Market
- Market Cap
- meme
- Momentum
- Pattern
- power
- pressure
- price
- Price Analysis
- rally
- range
- research
- Sellers
- setting
- started
- surge
- Trading
- Virtual
- Volatility
- volume
- week
- within


