Bitcoin (BTC) has bounced at the $30,000 support area.
Ethereum (ETH) has been decreasing since reaching a high of ₿0.085.
XRP (XRP) is trading inside an ascending parallel channel.
Reserve Rights (RSR) has bounced at the $0.031 support area.
Kava.io (KAVA) could potentially begin a 1-2/1-2 wave formation.
The Graph (GRT) is trading inside a descending parallel channel.
Dash (DASH) has bounced at the $190 support area.
BTC
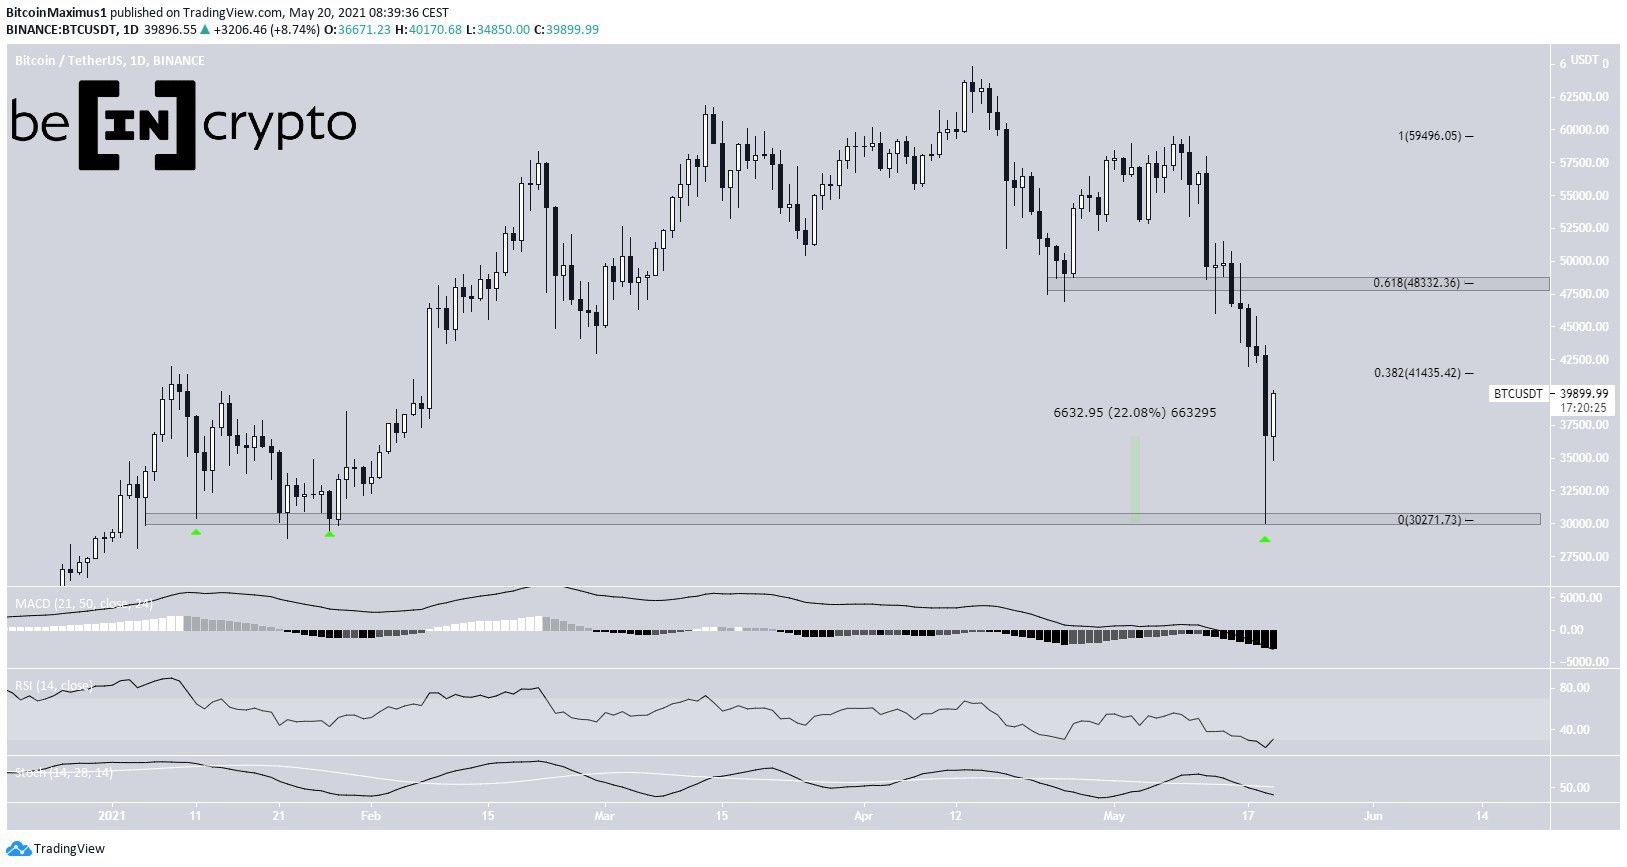
BTC decreased considerably yesterday, falling all the way to a low of $30,000. However, it has bounced since, and created a long lower wick, with a magnitude of 22%.
Despite the bounce, technical indicators do not yet provide any bullish reversal signs. The main resistance levels are found at $41,430 and $48,330.
It is possible that BTC will consolidate for a period of time.
ETH
ETH/BTC has been moving downwards since May 15, when it reached a high of ₿0.082. The high was made very close to the long-term ₿0.085 resistance area. It is probable that it was the top of wave three (black).
It reached the 0.382 Fib retracement support level at ₿0.0612 before bouncing.
However, it is possible that it will potentially complete a fourth wave pullback at the 0.5 or even the 0.618 Fib retracement support levels at ₿0.056 and ₿0.0496, respectively. This would complete a fourth wave pullback.

XRP
XRP/BTC has been falling since reaching a high of 3,903 satoshis on May 19. However, it managed to bounce, once reaching the support line of an ascending parallel channel.
It is possible that this is a running flat correction, especially since waves A:C had a 1:1 ratio.
If so, the price would be expected to increase at least to the 4,200 satoshi resistance area and potentially the 0.382 Fib retracement level resistance at 4,880 satoshis.

RSR
RSR has been moving downwards since April 16, when it reached an all-time high price of $0.119. The decrease accelerated once the token broke down below the $0.0695 area. On May 19, it managed to reach a low of $0.021.
However, it has bounced since, creating a lower wick with a magnitude of 95%.
This validated the $0.031 area as support. The area previously acted as resistance in Auust. 2020 (red icon), before being validated as support in February 2021.
The main resistance area is found at $0.0695, the level which previously acted as support.

DASH
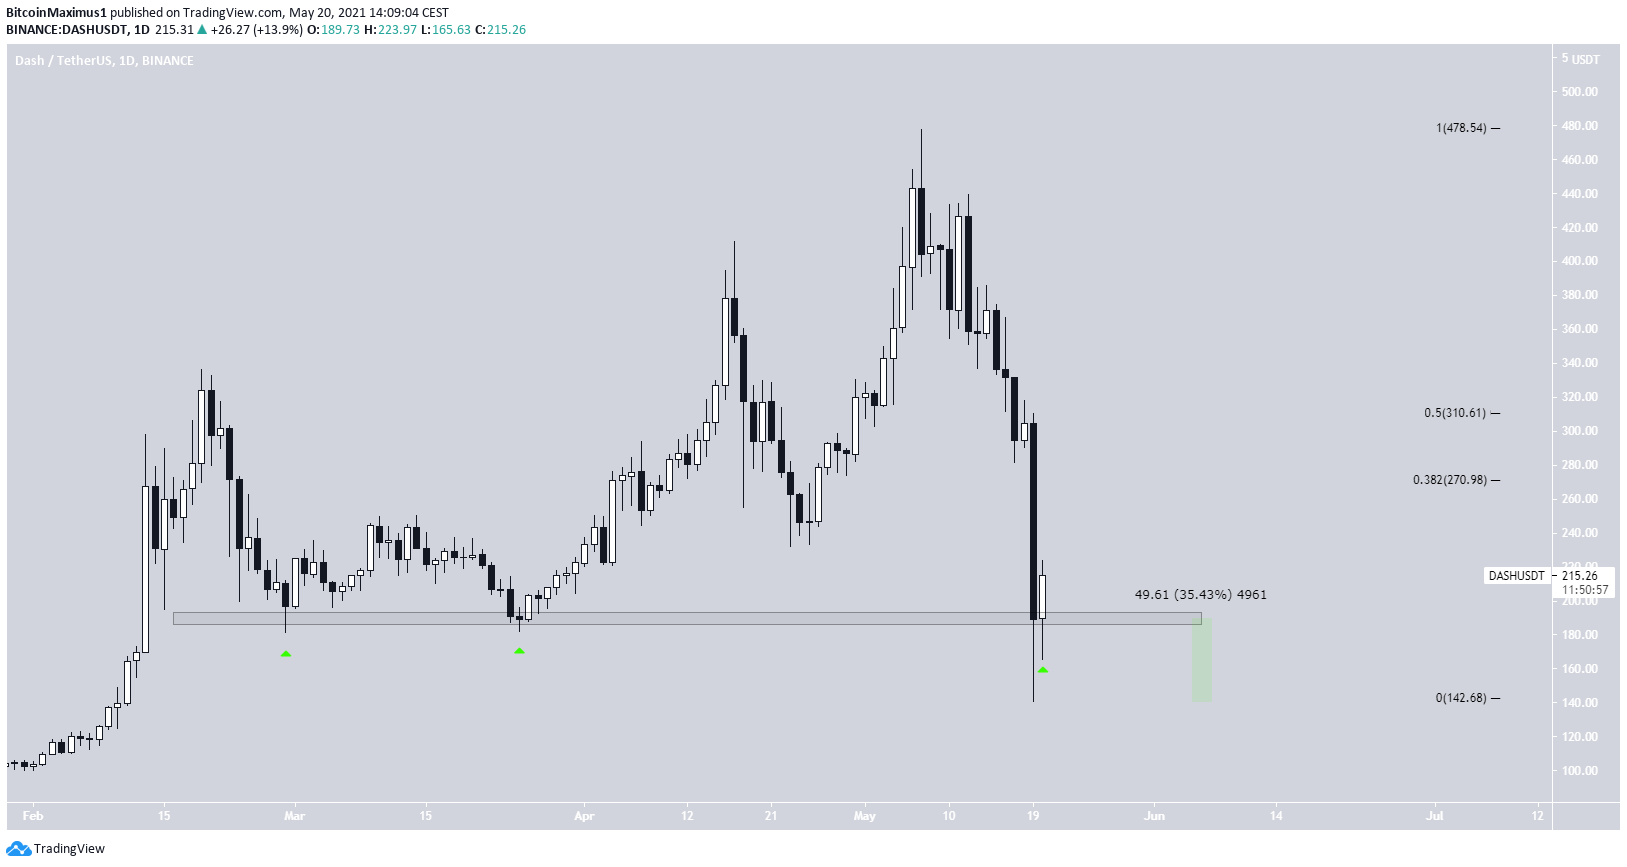
DASH has been decreasing since reaching a high of $478 on May 7. Yesterday, it reached a low of $140.73, before bouncing.
However, the bounce has been weak relative to other altcoins, with the lower wick being only 35%.
Nevertheless, the token has reclaimed the $190 area, validating it as support. This is the third touch of the level, the previous two occurring in February and March, respectively.
The closest resistance levels are found at $270 and $310, respectively.
KAVA
KAVA has been moving downwards since April 5. On May 19, it reached a low of $2.07, nearly touching a support line that has been in place since March 2020.
Besides it, there is no discernible pattern in place.
However, the support line is drawn connecting the lows of wave one and two (white). Since the line is still intact, it still allows for the possibility that the movement is a massive 1-2/1-2 wave formation, which would likely lead to an explosive breakout.

GRT
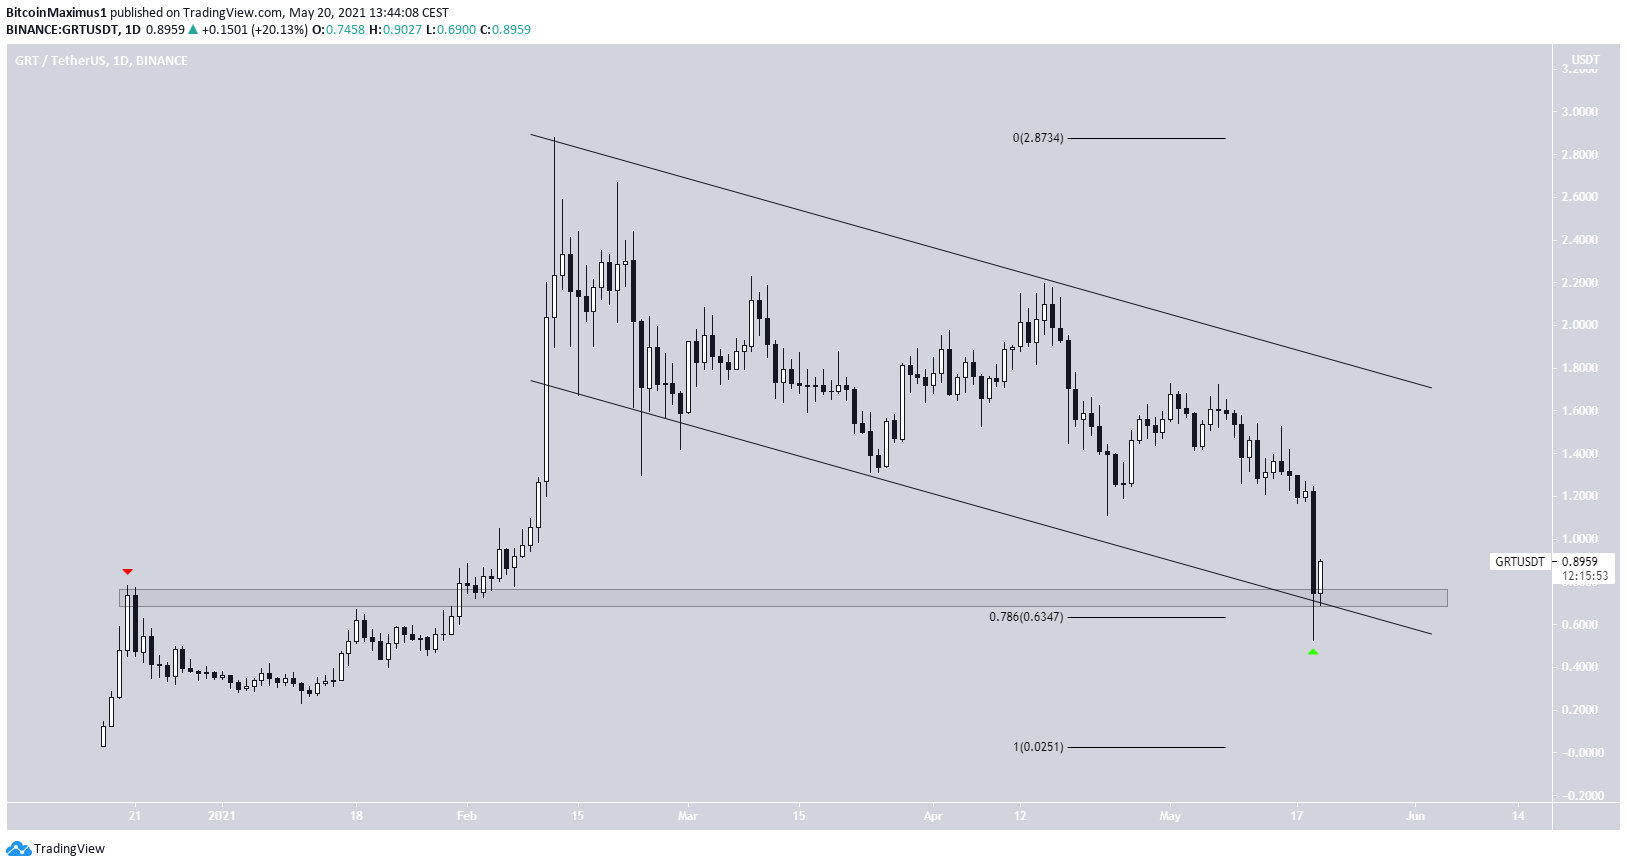
GRT has been decreasing alongside a descending parallel channel since Feb. 12, when it reached an all-time high price of $2.88.
On May 19, it reached a low of $0.52, before bouncing. The bounce coincided with the support line of the channel and the 0.786 Fib retracement level of the most recent upward movement.
Since then, it has reclaimed the $0.73 level, potentially validating it as support.
The area previously acted as resistance in December 2020. Therefore, it is a suitable spot for the initiation of a bounce.
For BeInCrypto’s latest bitcoin (BTC) analysis, click here.
Disclaimer
All the information contained on our website is published in good faith and for general information purposes only. Any action the reader takes upon the information found on our website is strictly at their own risk.
Source: https://beincrypto.com/btc-eth-xrp-rsr-dash-kava-grt-analysis-may-20/
- 000
- 2019
- 2020
- 7
- Action
- All
- Altcoins
- analysis
- April
- AREA
- barcelona
- Black
- breakout
- BTC
- Bullish
- Creating
- cryptocurrencies
- cryptocurrency
- Dash
- data
- Development
- Economic
- Economics
- ETH
- financial
- Focus
- General
- good
- graduate
- here
- High
- HTTPS
- ICON
- Increase
- information
- IT
- lead
- Level
- Line
- Long
- March
- march 2020
- Markets
- Other
- Pattern
- price
- Reader
- Risk
- Satoshi
- School
- Signs
- So
- Spot
- support
- support level
- Technical
- Technical Analysis
- time
- token
- top
- touch
- trader
- Trading
- Wave
- waves
- Website
- xrp
- youtube


