Published 2 hours ago
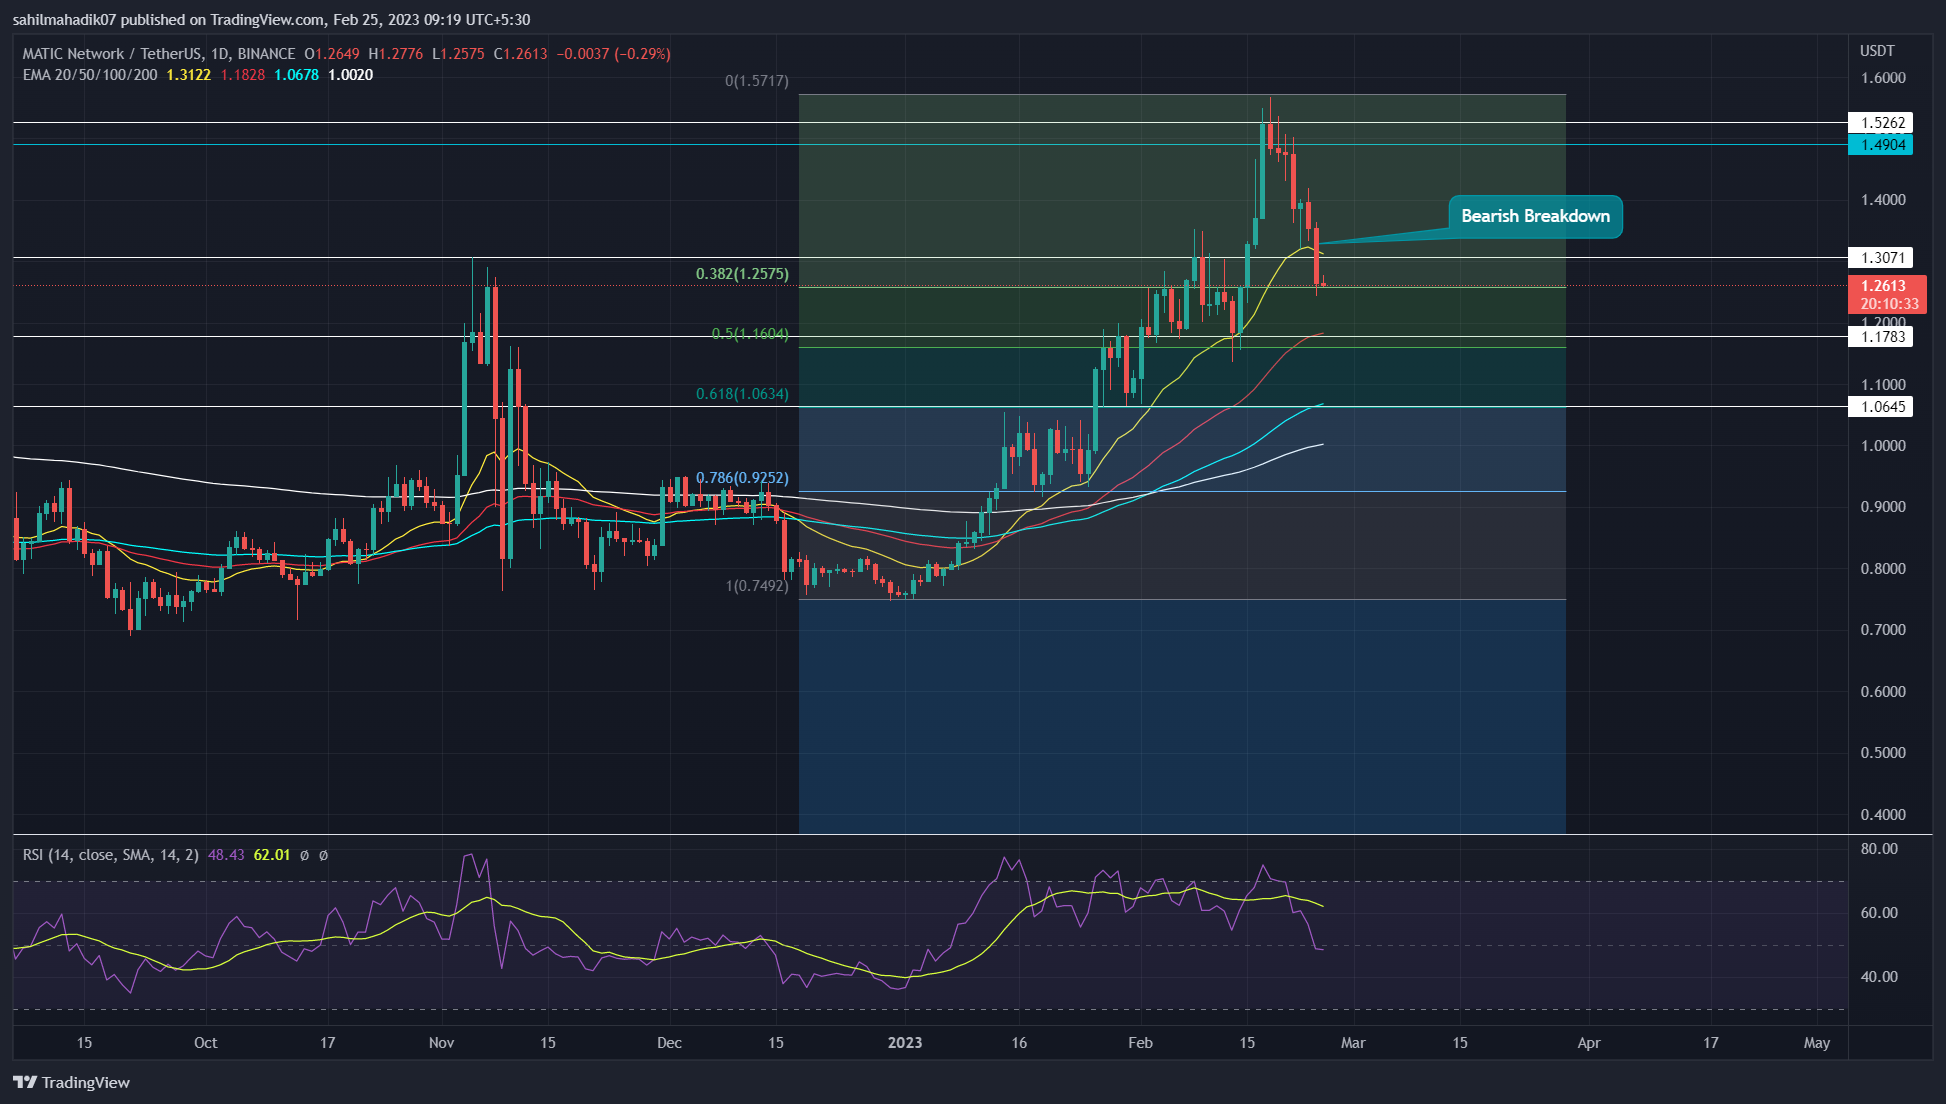
On February 15th, the MATIC coin price gave a strong breakout from the $1.3 neckline resistance of a rounding bottom pattern. The completion of this three-month-long pattern was supposed to accelerate the buying pressure and lead a direction uptrend. However, amid the ongoing uncertainty in the crypto market, the MATIC reversed from the $1.526 peak and plunged below the $1.3 support, showcasing failed breakout attempts or a bull trap.
advertisement
Key Points
- A V-top reversal in MATIC price indicates strong sellers’ confidence to tumble the prices lower
- The 50-day EMA moving near $1.178 and 100-day EMA at $1.06 increases the support strength of these levels
- The intraday trading volume in the MATIC is $735.2 Million, indicating a 37.5% gain.

 Source- -Tradingview
The last two weeks’ price action in MATIC price shows a V-top rejection from the $1.52 resistance levels. This type of rejection is characterized by an inverted V structure showcasing a rapid downfall in an asset’s price.
During this downfall, the polygon coin price lost 17.5% in market value and broke below the $1.3 support On February 24. A substantial loss on the aforementioned date could be associated with the release of the Personal Consumption Expenditures (PCE) price index showing higher than the expected value. As a result of this data, the US Fed is more likely to tighten its interest rate hike program, putting market sentiment under bearish turmoil.
Trending Stories
Also Read: Bitcoin ($BTC) Quickly Losing Support Range; Price At $21K Next?
Thus, the $1.3 breakdown undermines the prior breakout and increases the possibility of further losses. If the altcoin sustains below the breached support, the sellers may drive the prices to $1.178( near the 0.5 Fibonacci retracement level), followed by $1.06(0.618 FIB level).
Any further breakdown will question the credibility of the overall bullish trend.
Technical Indicators
RSI: The daily RSI slope breakdown below the midline indicates the bullish sentiment fading away.
advertisement
EMAs: The recent downfall breached the 20-day EMA slope which offered dynamic support during the last recovery cycle. This breakdown gives sellers an additional edge to put MATIC on a longer correction.
MATIC Coin Price Intraday Levels
- Spot rate: $1.26
- Trend: Bearish
- Volatility: Low
- Resistance levels- $1.3, and $1.52
- Support levels- $1.17 and $1.06
Share this article on:
advertisement
The presented content may include the personal opinion of the author and is subject to market condition. Do your market research before investing in cryptocurrencies. The author or the publication does not hold any responsibility for your personal financial loss.
<!– Close Story–>
- SEO Powered Content & PR Distribution. Get Amplified Today.
- Platoblockchain. Web3 Metaverse Intelligence. Knowledge Amplified. Access Here.
- Source: https://coingape.com/markets/bull-trap-puts-matic-price-at-15-downside-risk-keep-holding/
- 1
- 10
- 15%
- 7
- 9
- a
- accelerate
- Action
- Ad
- Additional
- Altcoin
- Amid
- and
- article
- associated
- Attempts
- author
- avatar
- banner
- bearish
- Beauty
- before
- below
- blockchain
- Bottom
- Breakdown
- breakout
- Brian
- Broke
- bull
- bull trap
- Bullish
- Buying
- characterized
- Coin
- Coingape
- COM
- completion
- condition
- confidence
- consumption
- content
- could
- Credibility
- crypto
- Crypto Market
- cryptocurrencies
- cryptocurrency
- cycle
- daily
- data
- Date
- different
- direction
- downfall
- downside
- drive
- during
- dynamic
- Edge
- EMA
- Entertainment
- expected
- Failed
- Fashion
- February
- Fed
- Fibonacci
- finance
- financial
- follow
- followed
- from
- further
- Gain
- gives
- higher
- Hike
- hold
- holding
- HOURS
- However
- HTTPS
- in
- include
- Including
- Increases
- indicates
- interest
- INTEREST RATE
- interest rate hike
- investing
- journalism
- Keep
- Last
- lead
- Level
- levels
- likely
- longer
- losing
- loss
- losses
- Market
- market research
- market sentiment
- Matic
- MATIC price
- million
- more
- moving
- Near
- next
- offered
- ongoing
- Opinion
- overall
- past
- Pattern
- pce
- Peak
- personal
- plato
- Plato Data Intelligence
- PlatoData
- plugin
- Polygon
- Polygon (MATIC)
- possibility
- presented
- pressure
- price
- PRICE ACTION
- Prices
- Prior
- Program
- Publication
- put
- Puts
- Putting
- question
- quickly
- range
- rapid
- Rate
- Rate Hike
- Read
- recent
- recovery
- release
- research
- Resistance
- responsibility
- result
- retracement
- Reversal
- Risk
- Sellers
- sentiment
- Share
- showcasing
- Shows
- Slope
- strength
- strong
- structure
- subject
- substantial
- support
- supposed
- The
- to
- Topics
- Trading
- trading volume
- TradingView
- Trend
- trending
- Uncertainty
- under
- uptrend
- us
- us fed
- value
- variety
- volume
- which
- will
- working
- written
- years
- Your
- zephyrnet


