SNEAK PEEK
- ADA faces resistance after hitting an intraday high of $0.4353.
- Bears control ADA market, price dips over 3%.
- ADA’s trading volume rises despite market correction.
Cardano (ADA) bulls recorded an intra_day high of $0.4353 before facing stiff resistance and retreating. As a result of this correction, the ADA price dipped to a 24-hour low of $0.412, where support was established. According to renowned crypto trader @Alicharts, this correction was imminent; however, bulls still have a chance at recovery if they retest the support zone.
#Cardano | The recent correction looks like a bullish retest before $ADA reaches the target of this inverse head & shoulders formation.
Still, the 200EMA on the daily chart at $0.39 must hold #ADA for the bullish outlook to remain valid. pic.twitter.com/AxNoKUJLCS
— Ali (@ali_charts) April 19, 2023
As of press time, the bears still controlled the ADA market, prompting the price to devalue by 3.45% to $0.4197.
During this correction, ADA’s market capitalization decreased by 3.44% to $14,597,312,954, while its 24-hour trading volume increased by 82.83% to $589,216,179. The overall market correction in the cryptocurrency sector is to blame for the decline in market capitalization. The rise in trading volume, however, suggests that there is still more interest in and activity surrounding ADA.
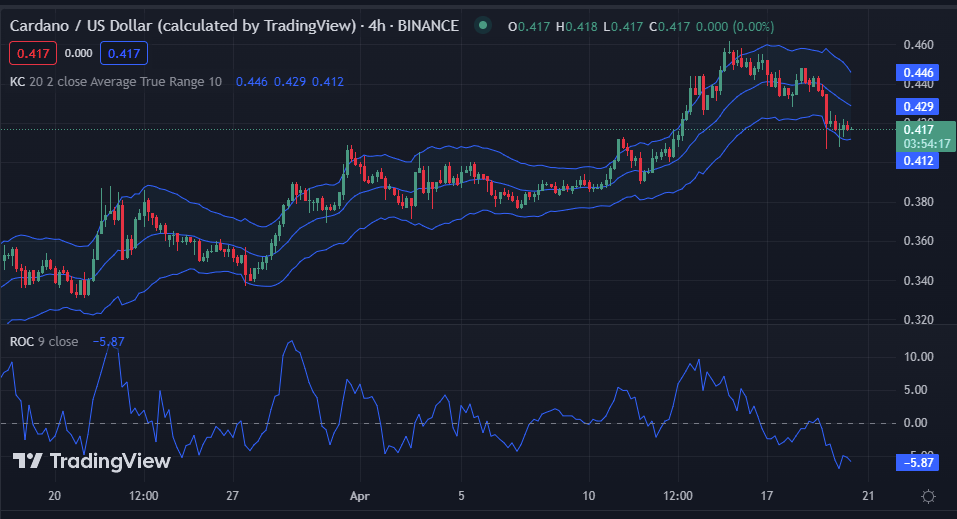
The Keltner Channel (KC) bands are heading south on the ADA 4-hour price chart, with the top bar at 0.449 and the bottom at 0.412. This means that the price of ADA may soon drop even more and test the lower support level. A reversal or comeback may occur if the price movement keeps going in this direction and breaks below the lower band, which indicates that the market is oversold.
The market has strong negative momentum with a Rate of Change (ROC) of -4.32, which might cause further downward movement if price activity breaks crucial support levels. A change in momentum and potential buying opportunities for traders could be indicated if, on the other hand, the ROC rating strengthens and moves into positive territory.

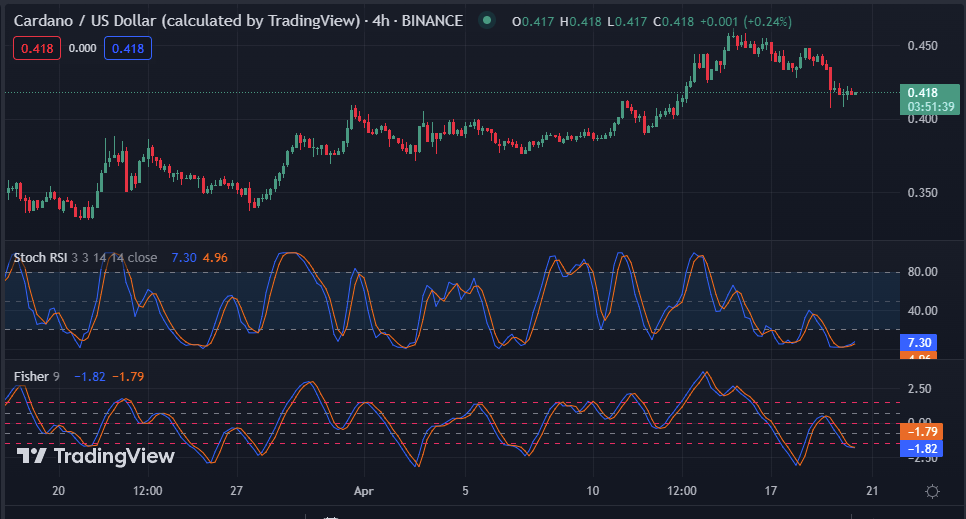
A Fisher Transform rating of -1.76, below the signal line, indicates that the bearish trend in the ADA market may gain traction and push the price even lower. This action suggests that selling pressure is increasing. Therefore, traders may think about going short or holding off on creating long positions until there is a potential trend reversal.
The stochastic RSI for the ADA market is 8.00 on the 4-hour price chart. This action indicates an oversold condition in the ADA market and a potential price reversal soon. Traders can consider buying ADA now to take advantage of the probable price increase.

ADA faces a bearish trend with increased selling pressure, but an oversold condition suggests a potential price reversal. Traders weigh short or long positions.
Disclaimer: Cryptocurrency price is highly speculative and volatile and should not be considered financial advice. Past and current performance is not indicative of future results. Always research and consult with a financial advisor before making investment decisions.
- SEO Powered Content & PR Distribution. Get Amplified Today.
- Platoblockchain. Web3 Metaverse Intelligence. Knowledge Amplified. Access Here.
- Minting the Future w Adryenn Ashley. Access Here.
- Source: https://investorbites.com/cardano-ada-price-analysis-20-04/
- :has
- :is
- $589
- 10
- 39
- 7
- 8
- a
- About
- According
- Action
- activity
- ADA
- ada price
- ADA/USD
- ADvantage
- advice
- advisor
- After
- always
- analysis
- analyzing
- and
- ARE
- AS
- At
- BAND
- bar
- BE
- bearish
- Bears
- before
- below
- blockchain
- Bottom
- breaks
- Bullish
- Bulls
- Buying
- by
- CAN
- capitalization
- Cardano
- Cardano News
- cardano price
- Cardano price analysis
- Cause
- Center
- Chance
- change
- Channel
- Chart
- Comeback
- condition
- Consider
- considered
- control
- controlled
- could
- Creating
- crucial
- crypto
- cryptocurrency
- Current
- daily
- decisions
- Decline
- Despite
- direction
- downward
- Drop
- established
- Even
- external
- faces
- facing
- financial
- financial advice
- For
- formation
- further
- future
- Gain
- going
- hand
- Have
- head
- Heading
- High
- highly
- hitting
- hold
- holding
- However
- HTTPS
- in
- Increase
- increased
- increasing
- indicated
- indicates
- interest
- internal
- investment
- ITS
- Level
- levels
- like
- Line
- Long
- LOOKS
- Low
- Making
- Market
- Market Capitalization
- market correction
- Market News
- max-width
- May..
- means
- might
- Momentum
- more
- movement
- moves
- negative
- news
- of
- on
- opportunities
- Opportunity
- Other
- Outlook
- over
- overall
- past
- performance
- plato
- Plato Data Intelligence
- PlatoData
- positions
- positive
- potential
- press
- pressure
- price
- Price Analysis
- price chart
- Price Increase
- Push
- Rate
- rating
- Reaches
- recent
- recorded
- Recover
- recovery
- remain
- Renowned
- research
- Resistance
- result
- Results
- Reversal
- Rise
- Rises
- rsi
- sector
- Selling
- Short
- should
- Signal
- signals
- Source
- South
- Still
- Strengthens
- strong
- Suggests
- support
- support level
- support levels
- Surrounding
- Take
- Target
- territory
- test
- that
- The
- therefore
- time
- to
- top
- traction
- trader
- Traders
- Trading
- trading volume
- TradingView
- Transform
- Trend
- volatile
- volume
- weigh
- What
- What is
- which
- while
- with
- zephyrnet


