SNEAK PEEK
- MATIC price drops despite the high trading volume and large transfers.
- Bearish sentiment prevails, with indicators suggesting potential short positions.
- Falling Keltner Channel bands indicate a downward trend, but oversold MATIC could rebound.
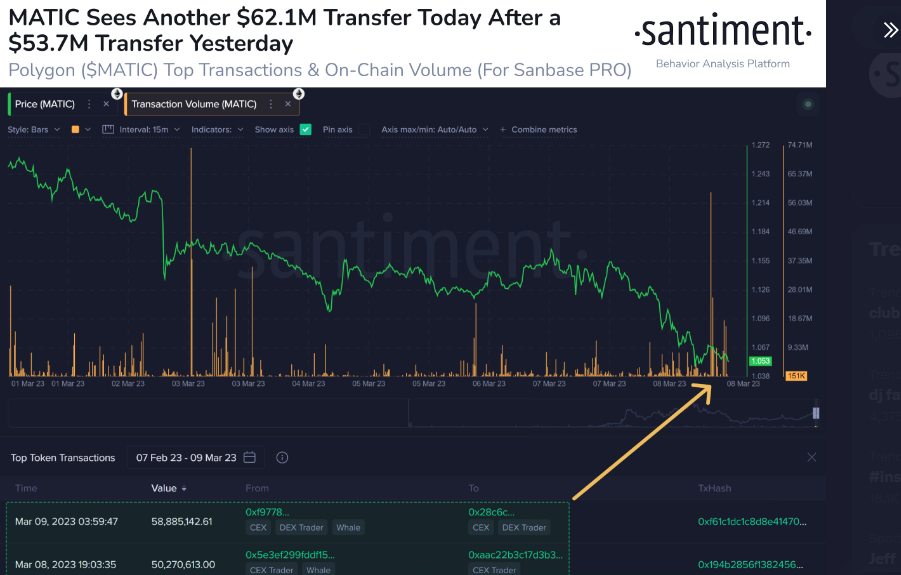
Despite a $62.1 million transfer today and a $53.7 million transfer yesterday, bullish momentum has failed to break past the intraday high of $1.09 after plunging to a week low of $1.09 in the last 24 hours. When this was written, MATIC’s price had fallen to $0.9991, a drop of 5.53%, as bearish sentiment prevailed.
🐳 #Polygon has seen a few massive whale transactions the past 16 hours, both on-exchange whale addresses moving assets. These were its 2 largest transactions in over 6 weeks. $MATIC has retraced -33% since hitting its local top of $1.55 on February 17th. https://t.co/900jU4siaV pic.twitter.com/zEBOvMhpHM
— Santiment (@santimentfeed) March 9, 2023
This negative market sentiment was reflected in a 5.47% drop in market cap to $8,726,294,143 as many investors dumped their MATIC holdings.
The 24-hour trading volume, on the other hand, increased by 39.75% to $781,772,345 (implying that there may be some buying opportunities for investors willing to take the risk and hold their positions for the long term). Despite the recent price drop, the increased trading volume indicates a higher level of interest in the asset.

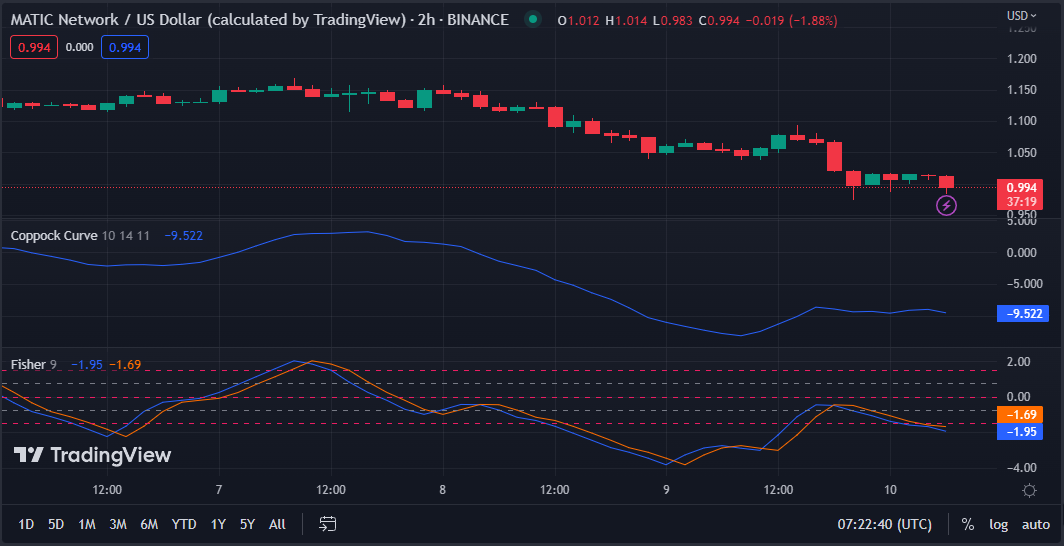
With the Coppock Curve at -9.763, traders may consider short positions or wait for a potential trend reversal before entering long positions. This viewpoint has emerged as the bearish hand in the MATIC market is strengthening.
This bearish outlook is reinforced by the Fisher Transform’s recent dip below its signal line and subsequent move into the negative region, where it currently sits at -1.95. This motion implies that the MATIC market’s momentum is leaning toward the bears.
As a result of this change, traders may consider entering short positions in the MATIC market while looking closely for signs of a trend reversal.

Falling Keltner Channel bands with the top bar at 1.092 and the bottom bar at 0.997 indicate that the price of MATIC is trending downwards and may continue to do so until it reaches the lower band. Traders may utilize this data to establish protective stop-loss orders and evaluate potential short positions.
Because the price action falls below the lower band, this move may indicate that the asset is oversold and could rebound soon, so traders should consider this possibility before making any decisions.
The Chaikin Money Flow (CMF) moving in the negative region with a reading of -0.06 indicates that there is selling pressure in the market and the asset is experiencing a net outflow of money, which could support the idea of a potential rebound soon.

MATIC’s bearish momentum continues as traders eye potential short positions, but increased trading volume suggests buying opportunities for the daring.
Disclaimer: In good faith, we disclose our thoughts and opinions in our price analysis and all the facts we give. Each reader is responsible for his or her investigation. Reader discretion is advised before taking any action
- SEO Powered Content & PR Distribution. Get Amplified Today.
- Platoblockchain. Web3 Metaverse Intelligence. Knowledge Amplified. Access Here.
- Source: https://investorbites.com/polygon-matic-price-analysis-10-3/
- :is
- 1
- 39
- 7
- 9
- a
- Action
- addresses
- After
- All
- analysis
- and
- AS
- asset
- Assets
- At
- BAND
- bar
- BE
- bearish
- Bearish Momentum
- Bears
- before
- below
- boost
- Bottom
- Break
- Bullish
- Buying
- by
- cap
- Center
- change
- Channel
- Chart
- closely
- Consider
- continue
- continues
- could
- crypto
- crypto exchange
- Currently
- curve
- data
- decisions
- Despite
- detailed
- Dip
- Disclose
- discretion
- downward
- Drop
- Drops
- each
- emerged
- establish
- evaluate
- exchange
- experiencing
- external
- eye
- FAIL
- Failed
- faith
- Fallen
- Falls
- February
- few
- flow
- For
- For Investors
- Give
- good
- hand
- High
- higher
- hitting
- hold
- Holdings
- HOURS
- HTTPS
- idea
- in
- increased
- indicate
- indicates
- Indicators
- interest
- internal
- investigation
- Investors
- IT
- ITS
- large
- largest
- Last
- Level
- Line
- local
- Long
- looking
- Low
- Making
- many
- Market
- Market Cap
- Market News
- massive
- Matic
- MATIC price
- MATIC/USD
- million
- Momentum
- money
- motion
- move
- moving
- negative
- net
- news
- of
- on
- Opinions
- opportunities
- orders
- Other
- Outlook
- past
- plato
- Plato Data Intelligence
- PlatoData
- plunging
- Polygon
- Polygon Price
- Polygon price analysis
- positions
- possibility
- potential
- pressure
- price
- PRICE ACTION
- Price Analysis
- price chart
- Protective
- Reaches
- Reader
- Reading
- rebound
- recent
- reflected
- region
- responsible
- result
- Reversal
- Risk
- Santiment
- Selling
- sentiment
- Short
- should
- Signal
- Signs
- since
- So
- some
- Source
- strengthening
- subsequent
- Suggests
- support
- Take
- taking
- that
- The
- their
- These
- to
- today
- top
- toward
- Traders
- Trading
- trading volume
- TradingView
- Transactions
- transfer
- transfers
- Trend
- trending
- utilize
- volume
- wait
- week
- Weeks
- Whale
- whale addresses
- What
- What is
- which
- while
- willing
- with
- written
- zephyrnet


