SNEAK PEEK
- LINK shows strong support in the $6.38 – $6.93 range.
- Trading volume decreased by over 70% due to market slowdown.
- CMF suggests LINK’s bearishness may fade soon.
Chainlink prices may fall to $5.60, according to Ali’s latest tweet, “a renowned crypto analyst,” but the possibilities of bulls making a return are strong. This expectation stems from many individuals purchasing LINK between $6.38 and $6.93, demonstrating the solid support level at this price range.
Although there’s a chance that #Chainlink could fall to $5.60, the chances of it going up are higher.
This is because a lot of people bought $LINK when the price was between $6.38 and $6.93, which means there is a strong support level at this price range for #LINK. pic.twitter.com/j9NLnu5GoQ
— Ali (@ali_charts) April 28, 2023
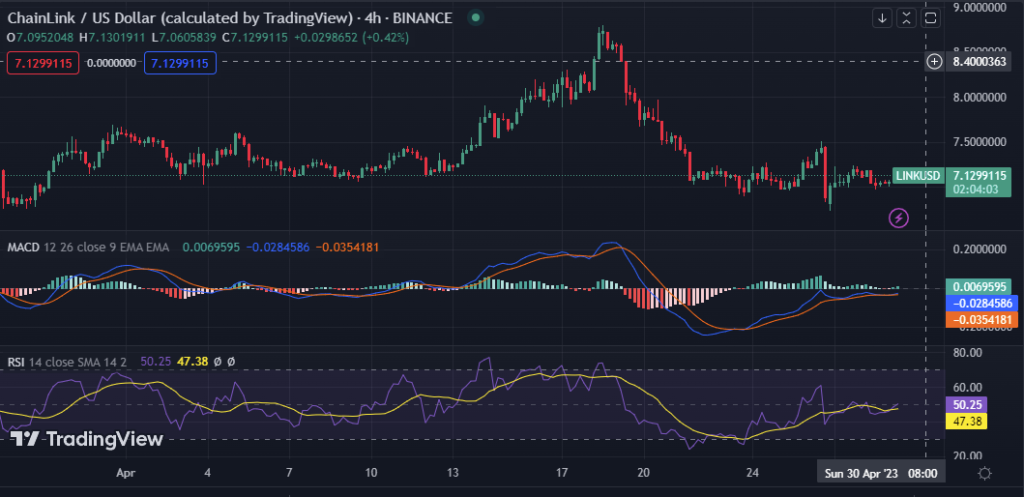
In the previous 24 hours, bearish momentum dominated the LINK market, causing the price to fall to a low of $6.99. Bullish momentum, on the other hand, bucked the bears’ rule, propelling the price to a high before encountering resistance around $7.14 and retreating to a value of $7.12 as of press time.
LINK market capitalization increased by 0.26% during the recovery to $3,680,099,713, but 24-hour trading volume decreased by 76.50% to $181,233,142. This decline in trading volume may be attributable to the broader market slowdown and a fall in investor activity. Still, the gain in market capitalization demonstrates that investors continue to support LINK.
On the price chart for the LINK market, the Relative Strength Index (RSI) is at 47.67, and the signal line is at 47.18. This movement shows that neither the bulls nor the bears have a clear advantage in the LINK market. To verify a trend reversal, traders can watch for a breakthrough above the signal line or below the oversold line.
The MACD blue line’s value is -0.0316407 on the 4-hour price chart for the LINK market, and its signal line is at -0.0360446. This motion represents a bearish indication for the LINK market and suggests that the price may drop soon. Until there is a more bullish signal, traders may want to think about selling or delaying purchases.

The Chaikin Money Flow (CMF) rating of 0.08 as it moves in the positive area suggests that LINK’s bearishness is likely to fade and that an increase in price movement is expected to occur soon. The move indicates that selling pressure is lessening, and if the CMF remains above zero for the following hours, a bullish trend may emerge.
On the LINK price chart, the Fisher Transform is at -0.99, and the signal line is at -1.13. This move shows that the bear’s power in LINK is strong, and traders should consider taking short positions or waiting for a reversal signal before beginning long bets. Traders should watch for any possibility of support levels that could give a buying opportunity.

In conclusion, as the bearish trend in the LINK market persists, traders should watch for future buying opportunities because the market may soon reverse.
Disclaimer: Cryptocurrency price is highly speculative and volatile and should not be considered financial advice. Past and current performance is not indicative of future results. Always research and consult with a financial advisor before making investment decisions.
- SEO Powered Content & PR Distribution. Get Amplified Today.
- PlatoAiStream. Web3 Data Intelligence. Knowledge Amplified. Access Here.
- Minting the Future w Adryenn Ashley. Access Here.
- Source: https://investorbites.com/chainlink-link-price-analysis-29-04/
- :is
- :not
- $3
- $UP
- 11
- 12
- 13
- 14
- 22
- 24
- 26%
- 28
- 67
- a
- About
- above
- According
- activity
- ADvantage
- advice
- advisor
- always
- an
- analysis
- analyst
- and
- any
- ARE
- AREA
- around
- AS
- At
- back
- BE
- bearish
- Bearish Momentum
- Bears
- because
- before
- Beginning
- below
- Bets
- between
- Blue
- bought
- breakthrough
- broader
- Bullish
- Bulls
- but
- Buying
- by
- CAN
- capitalization
- causing
- Center
- Chainlink
- Chainlink price analysis
- Chance
- chances
- Chart
- clear
- conclusion
- Consider
- considered
- continue
- could
- crypto
- crypto analyst
- Current
- decisions
- Decline
- demonstrates
- demonstrating
- Despite
- Dip
- Drop
- due
- during
- encountering
- expectation
- expected
- external
- fade
- Fall
- fight
- fight back
- financial
- financial advice
- flow
- following
- For
- from
- future
- Gain
- Give
- going
- hand
- Have
- High
- higher
- highly
- HOURS
- HTTPS
- if
- in
- Increase
- increased
- index
- indicates
- indication
- individuals
- internal
- investment
- investor
- Investors
- IT
- ITS
- latest
- Level
- levels
- likely
- Line
- LINK
- link price
- LINK/USD
- Long
- Lot
- Low
- MACD
- Making
- many
- Market
- Market Capitalization
- Market News
- max-width
- May..
- means
- Momentum
- money
- more
- motion
- move
- movement
- moves
- Neither
- news
- of
- on
- opportunities
- Opportunity
- or
- Other
- over
- past
- People
- performance
- persists
- plato
- Plato Data Intelligence
- PlatoData
- positions
- positive
- possibilities
- possibility
- power
- prediction
- press
- pressure
- previous
- price
- Price Analysis
- price chart
- Prices
- propelling
- purchases
- purchasing
- range
- rating
- recovery
- relative strength index
- remains
- Renowned
- represents
- research
- Resistance
- Results
- return
- Reversal
- reverse
- rsi
- Rule
- Selling
- Short
- should
- Shows
- Signal
- Slowdown
- solid
- Source
- stems
- Still
- strength
- strong
- Suggests
- support
- support level
- support levels
- taking
- that
- The
- There.
- think
- this
- time
- to
- Traders
- Trading
- trading volume
- TradingView
- Transform
- Trend
- tweet
- value
- verify
- volatile
- volume
- Waiting
- want
- was
- Watch
- when
- which
- with
- zephyrnet
- zero


