SNEAK PEEK
- Ethereum price analysis shows an uptrend at $1,827 after a bullish run.
- The Token has gained over 1.09 percent in the last 24 hours.
- Trading volume is rising as the bullish momentum takes hold.
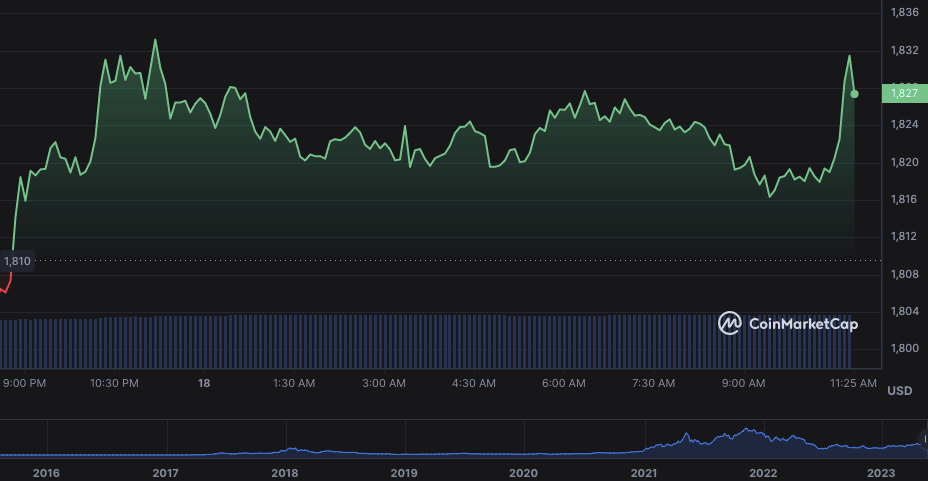
Today’s Ethereum price analysis continues to show a healthy uptrend in its value, with the digital asset now trading above $1,800. The price has gained over 1.09 percent in the last 24 hours and is currently trading at $1,827. The buying pressure is pushing ETH higher and looks set to remain buoyant for the foreseeable near term.

The market opened today’s trading section at $1,820, and since then, bullish sentiment has been the dominant force in the market. The resistance level for the token is set at $1,834. If Ethereum manages to break past this level, it could gain further momentum and push towards a test of the $1,850 level, and if bears take control, then the support level might be tested at $1,786.
The recent surge in Ethereum’s price is being driven by strong bullish momentum and increasing trading volumes. The trading volume over the past 24 hours has been higher than usual, with more than $6.2 billion worth of ETH changing hands during this time period. The market capitalization for the asset is also growing, currently sitting at $219 billion, with a gain of around 1.08 percent over the last 24 hours.
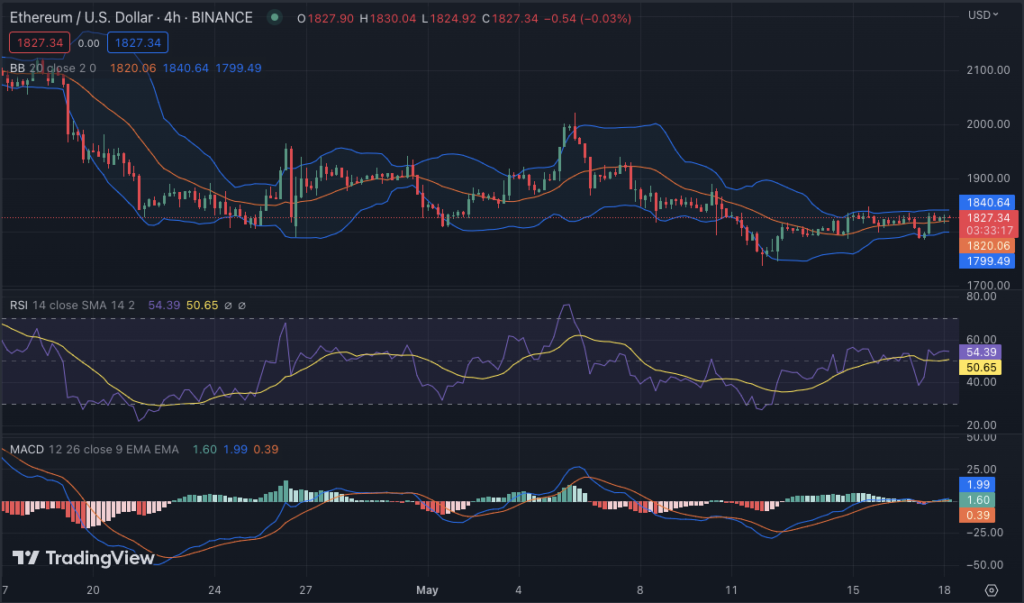
Looking at the hourly technical indicators, the Relative Strength Index (RSI) for ETH is currently hovering around the neutral region of 54 levels; however, if bullish momentum continues to dominate, it could push the RSI higher toward the overbought region. The Moving Average Convergence Divergence (MACD) also exhibits a bullish trend with an upward slope in the signal line. The histograms are widening, which could further indicate bullish momentum in play.

The four-hour Bollinger Bands are also wide open with no signs of any bearish divergence or contraction, suggesting that the asset’s price has already settled into a stable uptrend. The upper Bollinger Band is currently placed at $1,840, and if the bulls are able to breach this level, then the next resistance might be found at around $1,850, while the lower band is at $1,799.
Overall, the Ethereum price trend continues to remain in the hands of bullish forces, and with no immediate signs of a bearish divergence or contraction, it looks like ETH could be headed toward higher highs in the near term. However, any unexpected market news or events could cause a sharp price downturn for the asset.
Disclaimer: Cryptocurrency price is highly speculative and volatile and should not be considered financial advice. Past and current performance is not indicative of future results. Always research and consult with a financial advisor before making investment decisions.
- SEO Powered Content & PR Distribution. Get Amplified Today.
- PlatoAiStream. Web3 Data Intelligence. Knowledge Amplified. Access Here.
- Minting the Future w Adryenn Ashley. Access Here.
- Buy and Sell Shares in PRE-IPO Companies with PREIPO®. Access Here.
- Source: https://investorbites.com/ethereum-eth-price-analysis-18-05/
- :has
- :is
- :not
- 1
- 22
- 24
- a
- Able
- above
- advice
- advisor
- After
- already
- also
- always
- an
- analysis
- and
- any
- ARE
- around
- AS
- asset
- At
- average
- BAND
- BE
- bearish
- bearish divergence
- Bears
- been
- before
- being
- Billion
- Bollinger bands
- breach
- Break
- Bullish
- Bulls
- Buying
- by
- cap
- capitalization
- Cause
- changing
- Chart
- Coin
- Coin Market Cap
- considered
- continues
- contraction
- control
- Convergence
- could
- cryptocurrency
- Cryptocurrency Price
- Current
- Currently
- daily
- decisions
- digital
- Digital Asset
- discussion
- Divergence
- dominant
- Dominate
- DOWNTURN
- driven
- during
- ETH
- ETH/USD
- ethereum
- Ethereum News
- Ethereum Price
- Ethereum Price Analysis
- events
- exhibits
- extensive
- external
- financial
- financial advice
- For
- Force
- Forces
- foreseeable
- found
- further
- future
- Gain
- Growing
- Hands
- headed
- healthy
- higher
- highly
- Highs
- hold
- HOURS
- However
- HTTPS
- if
- immediate
- in
- increasing
- index
- indicate
- Indicators
- internal
- into
- investment
- investor
- IT
- ITS
- Last
- Level
- levels
- like
- Line
- LOOKS
- lower
- MACD
- Making
- manages
- Market
- Market Cap
- Market Capitalization
- Market News
- max-width
- might
- Momentum
- more
- moving
- moving average
- Near
- Neutral
- news
- next
- no
- now
- of
- open
- opened
- or
- over
- past
- percent
- performance
- period
- plato
- Plato Data Intelligence
- PlatoData
- Play
- pressure
- price
- Price Analysis
- price chart
- Push
- Pushing
- rallies
- recent
- region
- relative strength index
- remain
- research
- Resistance
- Results
- rising
- rsi
- Rule
- Run
- Section
- sentiment
- set
- Settled
- sharp
- should
- show
- Shows
- Signal
- Signs
- since
- Sitting
- Slope
- speculative
- stable
- strength
- strong
- support
- support level
- surge
- Take
- takes
- Technical
- term
- test
- than
- that
- The
- then
- this
- time
- to
- today’s
- token
- toward
- towards
- Trading
- trading volume
- TradingView
- Trend
- Unexpected
- uptrend
- upward
- value
- volatile
- volume
- What
- What is
- which
- while
- wide
- with
- worth
- zephyrnet


