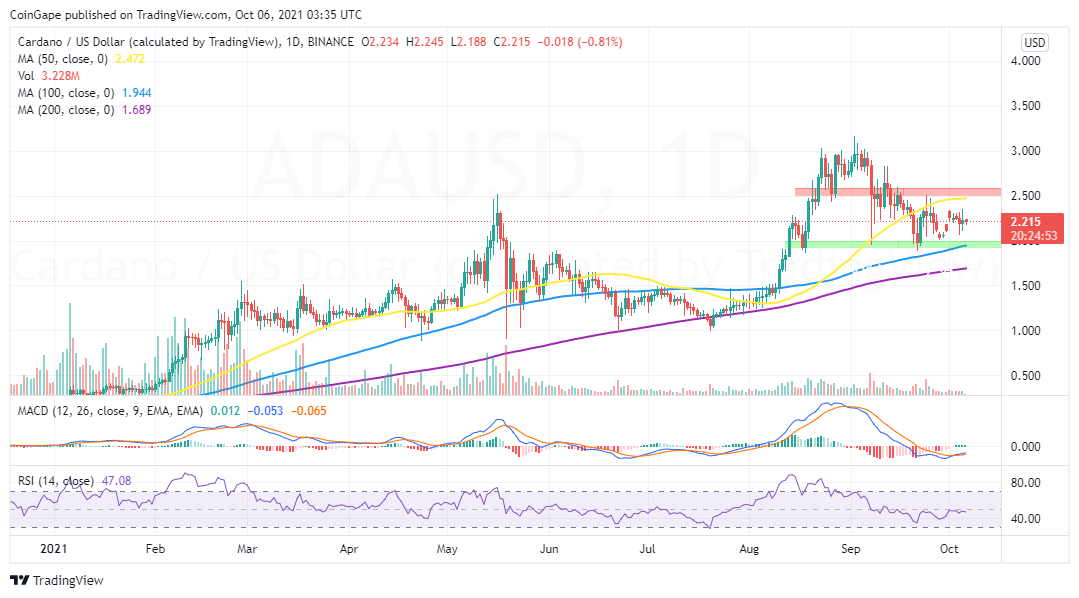
- Cardano price teeters within a wide range, marked by the 50-day SMA on the upside and the 100-day SMA on the downside.
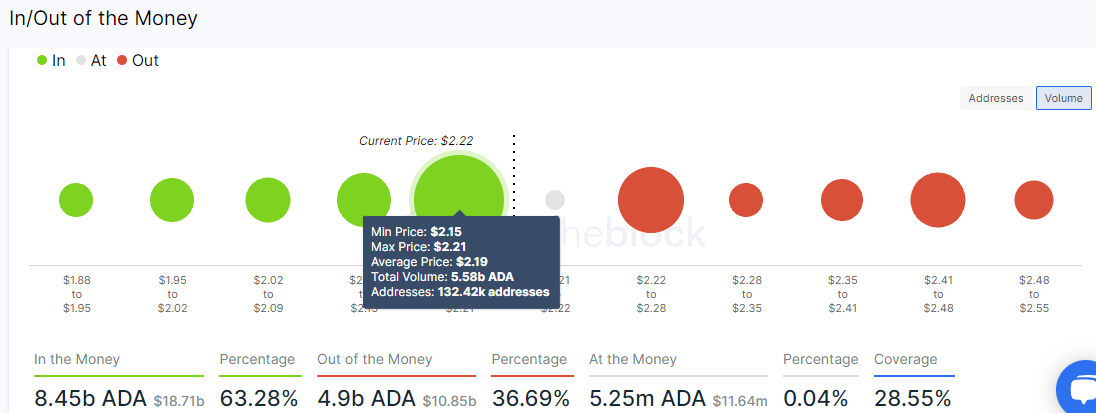
- The IOMAP model reveals that ADA sits on robust support while the absence of a massive resistance favors the bulls.
Cardano is seen trading at $2.2 on Monday toward the end of the Asian session. The smart contracts token is becoming competitive, biting into Ethereum’s piece of cake alongside Solana. However, its price action continues to be sluggish compared to Ethereum and Bitcoin.
Cardano Price Stuck In Wide Range
Cardano spears stuck in a wide range, marked by the demand zone in green and the red area in red on the daily chart. Bulls firmly defended the support accentuated by the 100-day Simple Moving Average (SMA), a move that ensured that declines did not stretch to $1.5.
The token commenced recovery together with other crypto assets on Friday but lost steam before reaching $2.5. The 50-day SMA added weight to the resistance, cutting short the uptrend eyeing $3.
Meanwhile, the Moving Average Convergence Divergence (MACD) highlights a buy signal hints at the trend leaning upward. As the 12-day Exponential Moving Average (SMA) crossed above the 26-day EMA, the odds soared in favor of the bulls. The momentum calculating technical index only needs to rally above the mean line to validate action above $2.5.
ADA/USD Daily Chart

At the same time, the Relative Strength Index (RSI) confirms that neither buyers nor sellers have the upper hand. This trend following tool also calculates the strength of the bulls and the bears. Currently, the leveling motion implies the prevailing consolidation will last longer.
The IOMAP by IntoTheBlock reveals the absence of a robust resistance with the ability to hinder bulls from achieving their goals, at least to $2.5. According to this on-chain metric, the only area of interest runs from $2.22 to $2.28.
Here, the slightly more than 101,500 addresses that purchased 2.41 billion ADA will be trying to break even, thus reducing the impact of the buyers. However, if the price slices through, the run-up to $2.5 will be quick.
Cardan IOMAP Chart

On the downside, Cardano sits on top of robust support spanning from $2.15 to $2.21. Here, around 132,400 addresses previously bought 5.58 billion ADA. It will not be easy for bears to break this support barrier, leaving ADA safely above $2.1.
- "
- Action
- ADA
- analysis
- AREA
- around
- Assets
- Bears
- Billion
- Bitcoin
- Bulls
- buy
- Cardano
- cardano price
- consolidation
- content
- continues
- contracts
- crypto
- cryptocurrencies
- Demand
- DID
- EMA
- ethereum
- financial
- Friday
- Goals
- Green
- here
- hold
- HTTPS
- Impact
- index
- interest
- intotheblock
- investing
- IT
- Line
- Market
- market research
- model
- Momentum
- Monday
- move
- Opinion
- Other
- price
- Price Analysis
- rally
- range
- recovery
- research
- Sellers
- Share
- Short
- Simple
- Steam
- support
- Technical
- time
- token
- top
- Trading
- within


