Polkadot is an open-source sharding multichain protocol that facilitates the cross-chain transfer of any data or asset types, not just tokens, thereby making a wide range of blockchains interoperable with each other. Polkadot was founded by the Web3 Foundation, a Swiss Foundation founded to facilitate a fully functional and user-friendly decentralized web, as an open-source project. It is a sharded multichain network, meaning it can process many transactions on several chains in parallel (“parachains”). This parallel processing power improves scalability.
Let us look at the technical analysis of DOT.
Past Performance
The DOT opened on October 26, 2021, at $44.51. A breakout from the previous resistance at $46.37 was seen, following an increase in the price. It closed on November 1, 2021, at $49.98. The weekly change was 12.29%.

DOT Technical Analysis
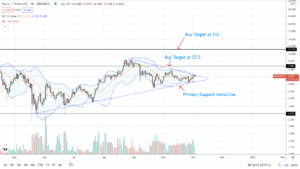
The DOT’s price movements were restricted earlier after which a breakout can be seen. However, this breakout lasted only for one day, and now it is trading again at $49.36, which is 1.28% down as compared to the previous day’s close. This was after it hit the resistance at $51.52. Let us see what the oscillators are indicating.
OBV is showing a slight dip at the end of its graph. This is showing that the buying pressure is reducing, putting more pressure on the price to decrease itself.
It has also hit an all-time high just a few hours ago at $51.47. This is in anticipation of the upcoming Parachain Auctions. Parachain auctions are held to decide which project will be next to connect to the Polkadot or Kusuma (KSM) blockchains. For a parachain project, this is an expensive undertaking in competition with other high-quality projects.
RSI has also reversed itself from entering the overbought region. It is currently at 66.14%. This is again a slightly bearish signal, meaning the traders may be cautious here.
MACD is showing a bullish crossover, i.e., the fast line has overtaken the slow line. Both the lines are heading in a positive direction, giving a positive signal to the traders.
Polkadot has also announced a workshop on November 5, 2021, at 2 PM CET, for aspiring developers to learn how to create programs on their platform.
Day-Ahead and Tomorrow
FIB Numbers suggest that the price’s sudden increase was seen after it came out from the fib pivot point at $46.39. The price has now crossed all the pivot points.
Thus, looking at all the indicators, there are mixed signals. The traders may set their target at $55 while keeping the stoploss at $44.41.
- 11
- 39
- 7
- 9
- 98
- All
- analysis
- announced
- asset
- bearish
- breakout
- Bullish
- Buying
- change
- closed
- competition
- data
- day
- decentralized
- decentralized web
- developers
- FAST
- Foundation
- Giving
- here
- High
- How
- How To
- HTTPS
- Increase
- IT
- keeping
- LEARN
- Line
- Making
- mixed
- network
- Other
- Pivot
- platform
- Polkadot
- power
- pressure
- price
- Programs
- project
- projects
- range
- Scalability
- set
- sharding
- Swiss
- Target
- Technical
- Technical Analysis
- Tokens
- Traders
- Trading
- Transactions
- us
- web
- Web3
- weekly


