SNEAK PEEK
- Whale’s ETH withdrawal sparks market speculation, signaling potential volatility.
- Bullish momentum propels Ethereum prices, creating positive market sentiment.
- The ETH market shows moderate volatility with potential short-term bearish trends.
Another whale withdrew $10,000 worth of ETH ($17.3 million) from Binance Exchange, which shocked the cryptocurrency world. Since whales frequently make significant moves before significant price swings, the move was interpreted as a precursor to future market volatility.
Another whale withdrew 10K $ETH ($17.3M) from #Binance 40 mins ago.https://t.co/maV1gNo8sxhttps://t.co/NOJFF3qdTB pic.twitter.com/DA2yQLfS23
— Lookonchain (@lookonchain) June 20, 2023
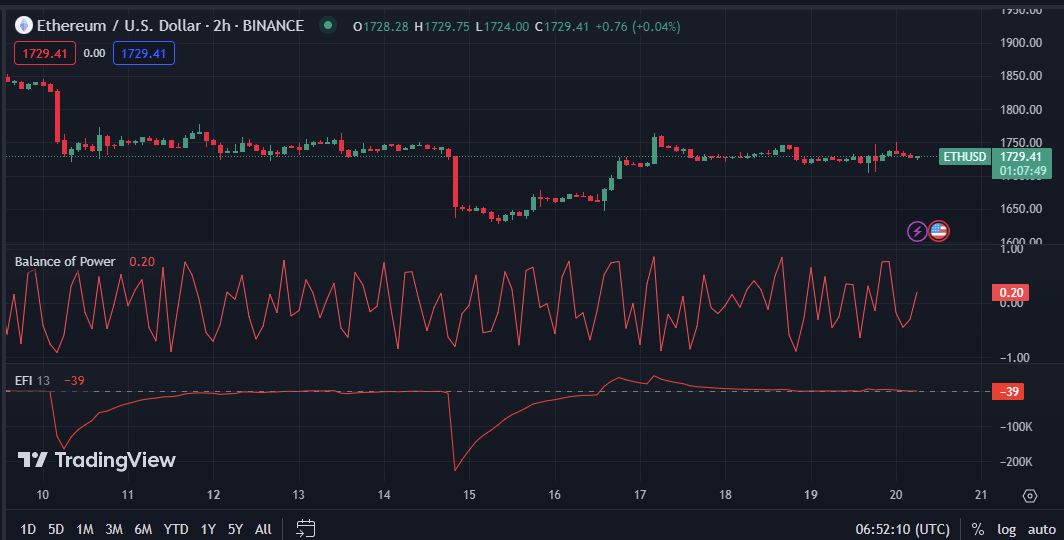
However, over the past 24 hours, bulls have dominated the Ethereum (ETH) market, propelling prices from intraday lows of $1,705.81 to highs of $1,748.64. Due to the continuous positive trend, the price was up 0.17% to $1,728.40 as of press time.
ETH’s market capitalization and 24-hour trading volume increased by 0.17% and 52.14%, reaching $$207,755,928,084 and $5,699,751,490, respectively. This growth indicates an upbeat market trend that suggests investors are becoming more confident in the performance of ETH.
The upper and lower Bollinger Bands (BB) readings on the ETH market are 1728.29 and 1726.53, respectively. These readings imply that the ETH market is not very volatile and that the price will remain in this range for some time. There could be opportunities for short-term traders to profit from the difference of 1.76 between the two bands, representing the average price movement in the ETH market.
The money flow index (MFI) line has a value of 41.36 and is directed southward on the price chart for the ETH market. This move signals a significant outflow of funds from the ETH market and the beginning of a short-term bearish trend. The fact that prices are most likely to fluctuate within a reasonably narrow range suggests that the ETH market is moderately volatile.

The Elder Force Index (EFI) has a line pointing south with a value of -39 on the 2-hour price chart of ETH. This move shows that intense selling pressure is now affecting the market, indicating a negative trend. This may be interpreted by traders and investors as a bearish signal, pointing to the possibility that the price of ETH will keep falling.
The Balance of Power (BOP) indicator shows a value of 0.25 and a line pointing south on the 2-hour price chart for the ETH market. This motion implies that the selling pressure is stronger than the buying demand at the moment and that the price of ETH may drop further soon.

In conclusion, as the whale’s ETH withdrawal raises volatility concerns, bullish momentum drives Ethereum prices higher, hinting at potential market shifts ahead.
Disclaimer: Cryptocurrency price is highly speculative and volatile and should not be considered financial advice. Past and current performance is not indicative of future results. Always research and consult with a financial advisor before making investment decisions.
- SEO Powered Content & PR Distribution. Get Amplified Today.
- EVM Finance. Unified Interface for Decentralized Finance. Access Here.
- Quantum Media Group. IR/PR Amplified. Access Here.
- PlatoAiStream. Web3 Data Intelligence. Knowledge Amplified. Access Here.
- Source: https://investorbites.com/ethereum-eth-price-analysis-20-06/
- :has
- :is
- :not
- $UP
- 000
- 1
- 10K
- 20
- 22
- 24
- 25
- 40
- a
- advice
- advisor
- affecting
- ago
- ahead
- always
- an
- analysis
- and
- ARE
- AS
- At
- average
- Balance
- BE
- bearish
- becoming
- before
- Beginning
- between
- binance
- Bollinger bands
- Bullish
- Bulls
- Buying
- by
- capitalization
- Center
- Chart
- Concerns
- conclusion
- confident
- considered
- continuous
- could
- Creating
- crypto
- crypto exchange
- cryptocurrency
- Current
- decisions
- Demand
- detailed
- difference
- discussion
- drives
- Drop
- due
- elder
- ETH
- eth market
- ETH/USD
- ethereum
- Ethereum News
- Ethereum Price
- Ethereum Price Analysis
- Ethereum prices
- exchange
- extensive
- external
- fact
- Falling
- financial
- financial advice
- flow
- fluctuate
- For
- Force
- frequently
- from
- funds
- further
- future
- Growth
- Have
- higher
- highly
- Highs
- HOURS
- HTTPS
- ignites
- in
- increased
- index
- indicates
- Indicator
- internal
- investigation
- investment
- investor
- Investors
- Keep
- likely
- Line
- lower
- Lows
- make
- Making
- Market
- Market Capitalization
- Market News
- market sentiment
- market volatility
- May..
- million
- moderately
- moment
- Momentum
- money
- more
- most
- motion
- move
- movement
- moves
- negative
- news
- now
- of
- on
- opportunities
- over
- past
- performance
- persists
- plato
- Plato Data Intelligence
- PlatoData
- positive
- possibility
- potential
- power
- precursor
- press
- pressure
- price
- Price Analysis
- price chart
- Prices
- Profit
- propelling
- raises
- range
- reaching
- remain
- representing
- research
- respectively
- Results
- s
- Selling
- sentiment
- Shifts
- shocked
- short-term
- should
- Shows
- Signal
- signals
- significant
- since
- some
- soon
- Source
- South
- Sparks
- speculation
- speculative
- stronger
- Suggests
- Swings
- than
- that
- The
- There.
- These
- this
- time
- to
- Traders
- Trading
- trading volume
- TradingView
- Trend
- Trends
- two
- value
- very
- volatile
- Volatility
- volume
- was
- Whale
- whales
- What
- What is
- which
- will
- with
- withdrawal
- within
- world
- worth
- zephyrnet


