Haven Protocol and Wanchain price actions are divergent. XHV might race to $30 as WAN crypto prices struggle below the $1.15 primary liquidation line.
Haven Protocol (XHV)
The privacy-focused protocol is a Monero fork using XHV as the primary currency.
Past Performance of XHV
The Haven Protocol token is solid as per the XHV technical analysis of the daily chart. Notably, the XHV crypto is adding to longs, outperforming the greenback on the last trading day.
Day-Ahead and What to Expect
As per the XHV/USDT candlestick arrangement of the daily chart, buyers are in the driving seat, easing above $10.
Since the XHV token is in an uptrend and bull bars banding along the upper BB, every low may offer entries for optimistic Haven Protocol crypto buyers targeting $30.
Haven Protocol Technical Analysis
The path of the least resistance is northward, as per the XHV/USDT technical of the daily chart.
Following strong gains of last week, traders may find entries on dips provided prices are trending above $10.
Since the upswing is with increasing momentum as bull bars align with the upper BB, the odds of XHV coin surging to $30 remain high.
Wanchain (WAN)
Past Performance of WAN
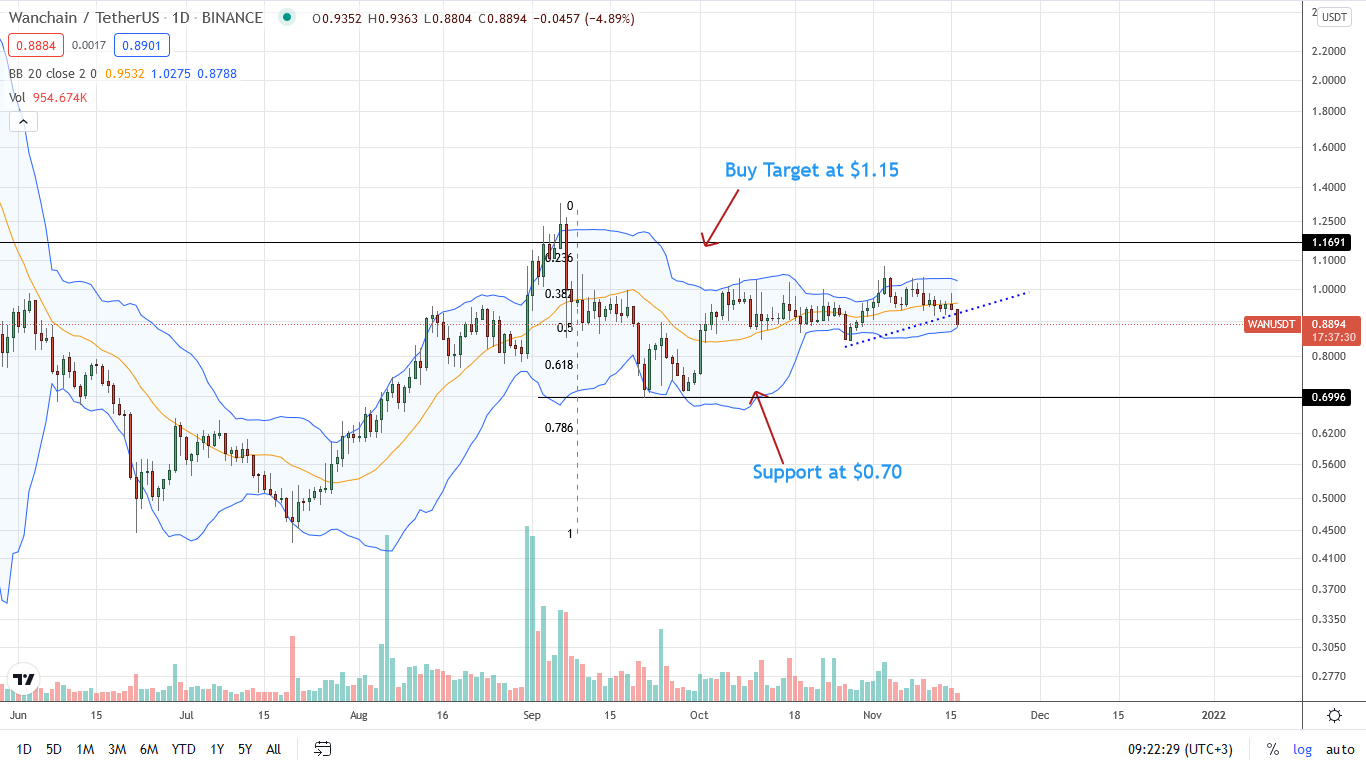
The Wanchain price remains in consolidation, as visible in the daily chart.
As per the WAN technical analysis, sellers appear to be in charge.
From the candlestick arrangement of the daily chart, bears have been in a commanding position, capping the uptrend in the past few days.
Day-Ahead and What to Expect
Despite the sell-off and inability of trend definition, there are hints of Wanchain buying pressure in the daily chart.
However, sellers are more pronounced and may wipe out gains should $0.90 fail.
On the flip side, there could be more room for expansion if WAN/USDT buyers take charge, confirming gains of early October above $1 and $1.15.
Wanchain Technical Analysis
Overall, Wanchain token buyers are struggling as per the candlestick arrangement of the daily chart.
Despite general optimism from the wider trading community, the series of lower lows and consolidation favor WAN coin sellers.
Already, there has been a drop below $0.90 and a minor support trend line which might see WAN/USDT slide to $0.70—the September 2021 lows.
On the reverse side, a high volume long-shot upthrust above $1.15 confirms buyers of early October, setting the base for a potential 2X to $2.6.


