SNEAK PEEK
- IOTA’s falling wedge formation indicates a midterm entry opportunity.
- Bullish momentum persists, driving IOTA’s price higher.
- Investor optimism remains despite the declining trading volume.
In the Weekly TF Chart for $IOTA, the Falling Wedge Formation has bottomed out and is promising for a midterm entry. If the Wedge Upside Breakout occurs, expectations for a midterm rally of +200–250% bullish are high. The next important resistance levels would be the targets for a potential long entry if the price broke out above the resistance line.
$IOTA Falling Wedge Formation in Weekly TF Chart.
Seems like Bottomed out & Looks Promising for Midterm ENTRY.
In Case of Wedge Upside Breakout, Expecting +200-250% Bullish Rally in Midterm.#Crypto #IOTA #IOTAUSDT pic.twitter.com/kwuxXI3zIs
— Captain Faibik (@CryptoFaibik) May 26, 2023
However, if the wedge breaks downward, it may signal a bearish reversal and a chance for a short entry. In the past 24 hours, bulls have dominated the IOTA market driving prices to an intraday high of $0.1966 from an intraday low of $0.1866.Due to the ongoing bullish trend, the price has increased by 4.07% to $0.1947 as of press time.
IOTA’s market capitalization increased by 4.07% to $541,159,261, while its 24-hour trading volume decreased by 16.65% to $9,519,738.This drop in trading volume may result from less investor activity or a market shift in favor of other assets. The rise in market capitalization indicates that investors are still optimistic about the long-term potential of the IOTA despite the decline in trading volume.
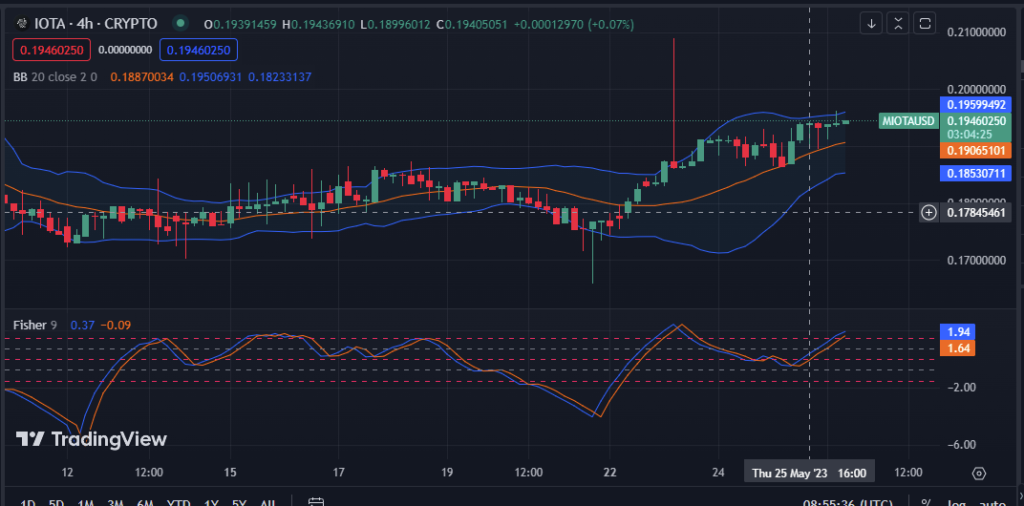
A Fisher Transform reading of 1.93 and a move above its signal line, which indicates a potential buying opportunity for traders hoping to capitalize on the upward trend, confirms the bullish stance in the IOTA market. If it falls below its signal line, a shift towards bearish sentiment may be indicated, and traders may want to think about taking profits or limiting losses.
The top and bottom Bollinger bands are at $0.19594931 and $0.18532922, respectively, indicating bullish momentum. It is anticipated that the upward trend in IOTA will soon continue as the bands widen and the market moves north. This action demonstrates that due to potential price increases in the future, IOTA investors might want to consider purchasing.

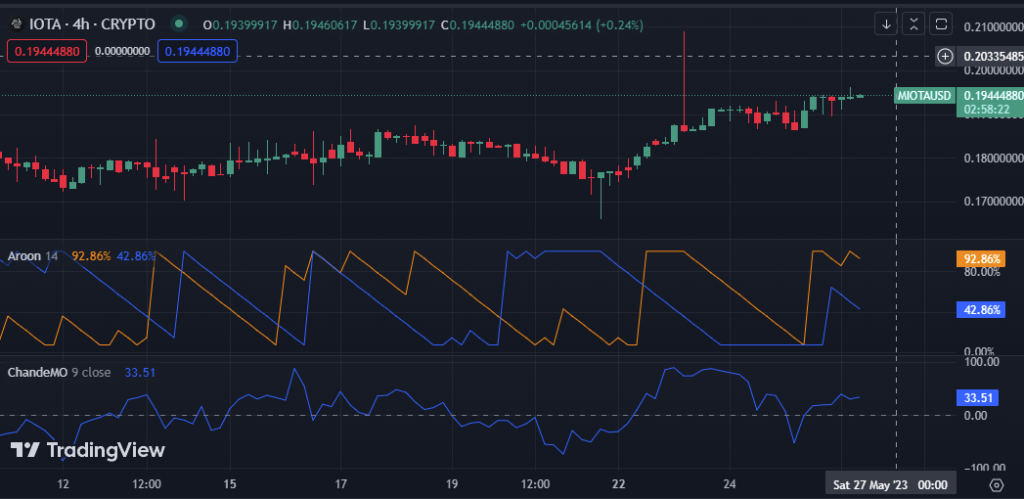
IOTA is in a strong uptrend, as indicated by the Aroon up and down readings of 92.86% and 42.86%, and the buying pressure is anticipated to continue. However, this pattern suggests that traders should proceed cautiously and use stop-loss orders to protect themselves from any sudden changes in the market that might result in a price decline.
The Chande Momentum Oscillator (ChandeMO), which has a value of 33.51, is trending north, suggesting that the market’s bullish momentum may persist. This action could cause the price to increase even further, boosting traders’ confidence in the IOTA market and convincing more investors to follow the upward trend.

In conclusion, IOTA is poised for a potential midterm rally of if a bullish breakout sustains. Caution is advised for a downside break, but the market shows upward solid momentum and investor optimism.
Disclaimer: Cryptocurrency price is highly speculative and volatile and should not be considered financial advice. Past and current performance is not indicative of future results. Always research and consult with a financial advisor before making investment decisions.
- SEO Powered Content & PR Distribution. Get Amplified Today.
- PlatoAiStream. Web3 Data Intelligence. Knowledge Amplified. Access Here.
- Minting the Future w Adryenn Ashley. Access Here.
- Buy and Sell Shares in PRE-IPO Companies with PREIPO®. Access Here.
- Source: https://investorbites.com/iota-miota-price-analysis-26-05/
- :has
- :is
- :not
- $UP
- 1
- 10
- 22
- 24
- 26%
- 7
- a
- About
- above
- Action
- activity
- advice
- advisor
- always
- an
- analysis
- and
- Anticipated
- any
- ARE
- AS
- Assets
- At
- BE
- bearish
- before
- below
- Bollinger bands
- boosting
- Bottom
- Break
- breakout
- breaks
- Broke
- Bullish
- Bulls
- but
- Buying
- by
- capitalization
- capitalize
- case
- Cause
- caution
- cautiously
- Center
- Chance
- Changes
- Chart
- conclusion
- confidence
- Consider
- considered
- continue
- could
- Current
- decisions
- Decline
- Declining
- demonstrates
- Despite
- down
- downside
- downward
- driving
- Drop
- due
- entry
- Even
- expectations
- expecting
- external
- Falling
- Falls
- favor
- financial
- financial advice
- follow
- For
- formation
- from
- further
- future
- Have
- High
- higher
- highly
- hoping
- HOURS
- However
- HTTPS
- if
- important
- in
- Increase
- increased
- Increases
- indicated
- indicates
- internal
- investment
- investor
- Investors
- IOTA
- IT
- ITS
- less
- levels
- like
- Line
- Long
- long-term
- LOOKS
- losses
- Low
- Making
- Market
- Market Capitalization
- market moves
- Market News
- max-width
- May..
- Midterm
- might
- Momentum
- more
- move
- moves
- news
- next
- North
- of
- on
- ongoing
- Opportunity
- Optimism
- Optimistic
- or
- orders
- Other
- out
- past
- Pattern
- performance
- persists
- plato
- Plato Data Intelligence
- PlatoData
- points
- poised
- potential
- press
- pressure
- price
- Price Analysis
- price chart
- Prices
- profits
- promising
- protect
- purchasing
- rally
- Reading
- remains
- research
- Resistance
- respectively
- result
- Results
- Reversal
- Rise
- sentiment
- shift
- Short
- should
- Shows
- Signal
- solid
- Source
- speculative
- Still
- strong
- sudden
- Suggests
- taking
- targets
- that
- The
- The Future
- The Weekly
- themselves
- think
- this
- time
- to
- top
- towards
- Traders
- Trading
- trading volume
- TradingView
- Transform
- Trend
- trending
- Upside
- uptrend
- upward
- use
- value
- volatile
- volume
- want
- weekly
- which
- while
- will
- with
- would
- zephyrnet


