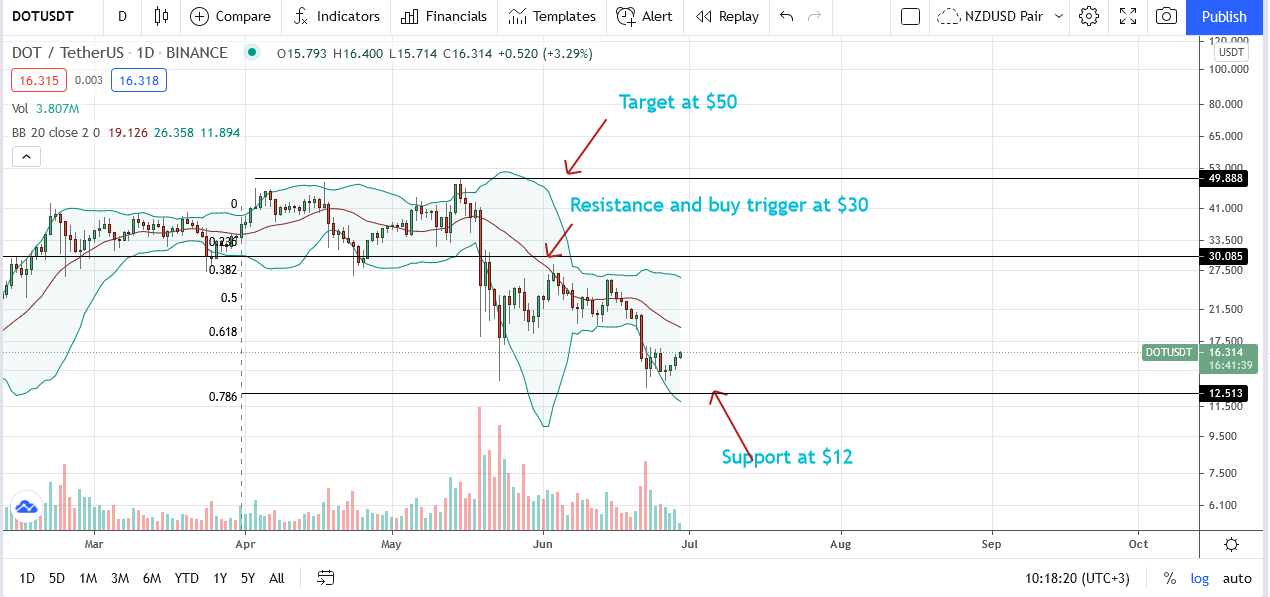
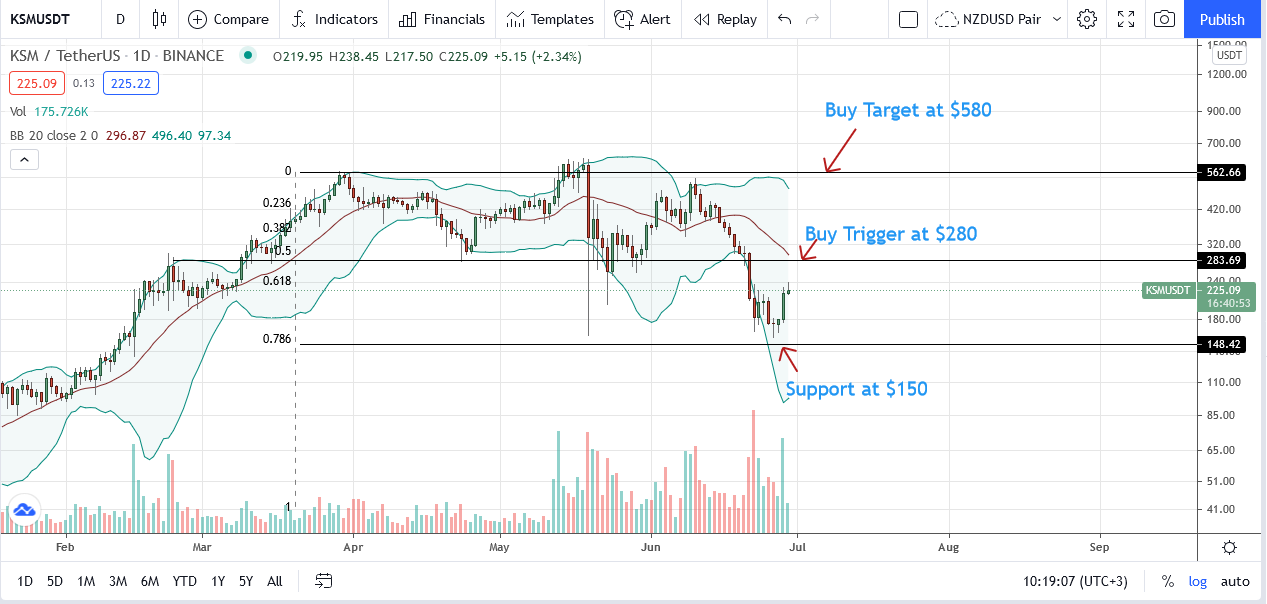
Polkadot and Kusama prices appear fused to the hip. KSM/USDT rose from $150 and may reach $230. On the other hand, DOT/USDT bulls are positive, provided prices range above $12.
Polkadot (DOT)
The Ethereum-competitor promotes interoperability using DOT.
Past Performance of DOT
DOT is under pressure, caving in the weight of determined sellers.
From price action in the daily chart, the downtrend is clear despite some bright lights in the last few days.
Although bears appear exhausted, there must be clear formation to signal reversal before traders commit.
At the time of writing, DOT is up roughly 10 percent versus the USD.
Day-Ahead and what to Expect
DOT/USD has support at around $10—the 78.6 percent Fibonacci retracement level of the H1 2021 trade range.
The middle BB still acts as the immediate resistance line. If anything, DOT prices will remain under sell pressure provided they oscillate inside H2 May 2021 trade range.
DOT/USDT Technical Analysis
There is an effort to correct the undervaluation of June 23.
As such, DOT may expand, allowing bulls to drive prices higher. In that case, a close above $17 may see DOT/USDT rise to $20—June 21 highs—and later $30.
Losses below $10 invalidate the uptrend, paving the way for further draw-down.
Kusama (KSM)
The Polkadot lab uses the KSM coin. The multi-chain uses the nominated proof-of-stake (NPoS) consensus style.
Past Performance of KSM
At the time of writing, KSM is in green, adding 26 percent in the last trading day.
There is a three-bar bullish reversal pattern and efforts to unwind losses of last week.
KSM bulls appear to be in control. However, it is not to forget that KSM prices are down over 70 percent from peaks.
Day-Ahead and What to Expect
KSM/USDT prices may recover from spot rates, building on the triple-bar bullish reversal pattern whose confirmation was on June 28.
Trading volumes are decent, indicating participation.
Concurrently, KSM/USDT is rebounding from the 78.6 percent Fibonacci retracement level, a key reaction point.
KSM/USD Technical Analysis
A combination of high volatility and a spike in participation indicates interest.
Accordingly, aggressive KSM traders may find buying opportunities at spot rates, targeting $280 as prices rebound.
Unexpected dips below $150 will nullify the uptrend, breaking KSM revival and allowing bears to reverse gains of the first half of 2021.
- "
- Action
- active
- Allowing
- analysis
- around
- Bears
- border
- Building
- Bullish
- Bulls
- Buying
- Coin
- community
- Consensus
- day
- Elon Musk
- Expand
- Figure
- First
- Green
- High
- HTTPS
- interest
- Interoperability
- IT
- Key
- Level
- Line
- Other
- Pattern
- performance
- Posts
- prediction
- pressure
- price
- Price Prediction
- Proof-of-Stake
- range
- Rates
- reaction
- Recover
- reverse
- sell
- Sellers
- Spot
- support
- Technical
- Technical Analysis
- time
- trade
- Traders
- Trading
- USD
- Versus
- Volatility
- writing
- year


