SNEAK PEEK
- Bears dominate MATIC as selling pressure rises, hinting at potential price swings.
- Increased trading activity amidst a bearish trend suggests market engagement.
- Negative indicators signal a possible price rebound for the oversold MATIC market.
In the past 24 hours, bears have held the upper hand on the Polygon (MATIC) market, with the $0.6522 support preventing further declines. At the intraday high of $0.6988, bullish attempts to regain market control encountered resistance, resulting in a price reversal.
As a result, bears retook control of the market, driving the price to $0.6614, a decrease of 2.96% during this writing.
While MATIC’s market capitalization decreased by 3.08% to $6,168,695,430, 24-hour trading volume increased by 31.29% to $399,952,178. This development suggests that the MATIC market has seen increased trading activity despite declining prices. The increased trading volume indicates significant purchasing and selling pressure, with market participants actively engaged.
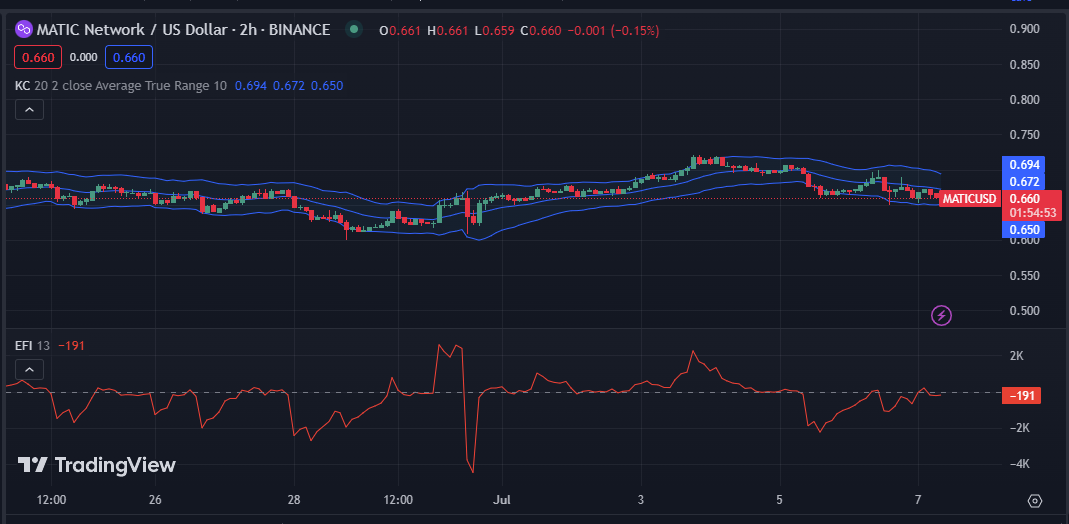
The Elder Force Index (EFI) on the 2-hour price chart for MATIC is negative, with a value of -191k, indicating increased selling pressure in the market, which could signal the start of a downward trend. Although the price of MATIC has decreased, a substantial price increase may be imminent.
The MATIC market’s upper and lower Kelter Channels (KC) values are 0.694 and 0.660, respectively. According to this movement, the market is in a substantial downtrend. If the price movement bursts through the bottom line, it may indicate continued downward momentum and offer opportunities for profit-taking or short-selling.

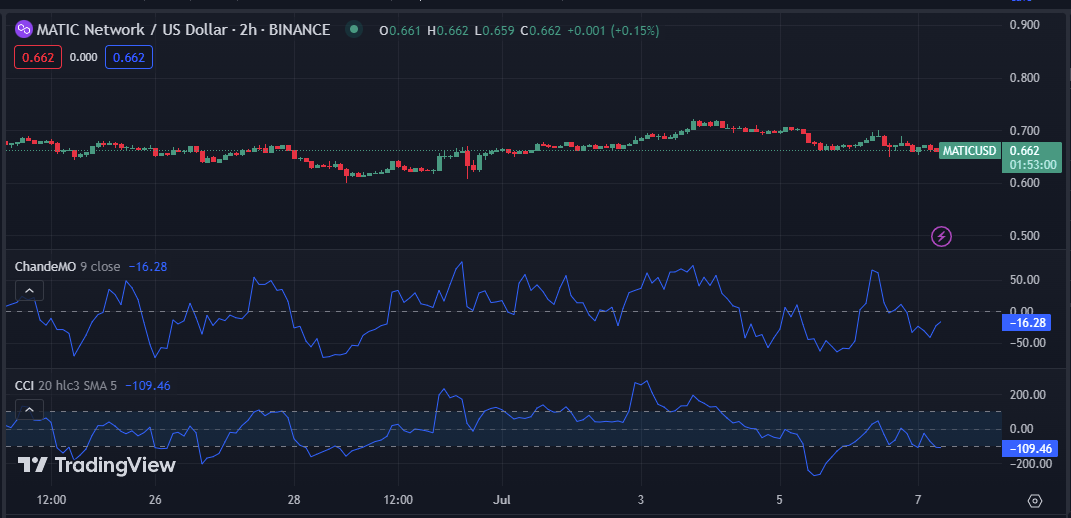
The Chande Momentum Oscillator (ChandeMO) on the 2-hour price chart of the MATIC market is negative, with a reading of -16.28. This move indicates that MATIC’s price has been falling rapidly on the market and may be due for a brief rebound because it is currently oversold.
The Commodity Channel Index (CCI), which is negative and has its line pointing south, has a value of -109.46 on the MATIC market’s 2-hour price chart. This movement indicates that the market is experiencing intense selling pressure and that a price reversal is imminent. MATIC is currently dipped, but a price increase may occur shortly.

In conclusion, bears maintain dominance on the MATIC market, but increased trading activity and oversold conditions hint at potential price reversals ahead. Traders should stay vigilant for possible market swings.
Disclaimer: Cryptocurrency price is highly speculative and volatile and should not be considered financial advice. Past and current performance is not indicative of future results. Always research and consult with a financial advisor before making investment decisions.
- SEO Powered Content & PR Distribution. Get Amplified Today.
- PlatoData.Network Vertical Generative Ai. Empower Yourself. Access Here.
- PlatoAiStream. Web3 Intelligence. Knowledge Amplified. Access Here.
- PlatoESG. Automotive / EVs, Carbon, CleanTech, Energy, Environment, Solar, Waste Management. Access Here.
- BlockOffsets. Modernizing Environmental Offset Ownership. Access Here.
- Source: https://investorbites.com/polygon-matic-price-analysis-07-07/
- :has
- :is
- :not
- 10
- 22
- 24
- 28
- 31
- a
- According
- actively
- activity
- advice
- advisor
- ahead
- Although
- always
- amidst
- analysis
- and
- ARE
- AS
- At
- Attempts
- BE
- bearish
- Bears
- because
- been
- before
- Bottom
- Bullish
- but
- by
- capitalization
- Channel
- channels
- Chart
- commodity
- conclusion
- conditions
- considered
- continued
- control
- could
- Current
- Currently
- decisions
- Declines
- Declining
- decrease
- Despite
- Development
- Dominance
- Dominate
- downtrend
- downward
- driving
- due
- during
- elder
- engaged
- engagement
- experiencing
- Falling
- financial
- financial advice
- For
- Force
- further
- future
- hand
- Have
- Held
- High
- highly
- HOURS
- HTTPS
- if
- imminent
- in
- Increase
- increased
- index
- indicate
- indicates
- Indicators
- internal
- investment
- investor
- IT
- ITS
- largest
- Line
- lower
- maintain
- Making
- Market
- Market Capitalization
- Market News
- market swings
- Matic
- MATIC/USD
- May..
- Momentum
- move
- movement
- negative
- network
- news
- of
- offer
- on
- opportunities
- or
- participants
- past
- performance
- plato
- Plato Data Intelligence
- PlatoData
- Polygon
- Polygon Price
- Polygon price analysis
- possible
- potential
- pressure
- preventing
- price
- Price Analysis
- price chart
- Price Increase
- Prices
- purchasing
- rapidly
- Reading
- rebound
- regain
- research
- Resistance
- respectively
- result
- resulting
- Results
- Reversal
- Rises
- seen
- Selling
- Short-selling
- Shortly
- should
- Signal
- signals
- Source
- South
- speculative
- start
- stay
- substantial
- Suggests
- support
- Swings
- that
- The
- this
- Through
- to
- Traders
- Trading
- trading volume
- TradingView
- Trend
- value
- Values
- volatile
- volume
- What
- What is
- which
- with
- writing
- zephyrnet


