SNEAK PEEK
- QNT skyrockets to a 7-day high as bullish sentiment fuels investor excitement.
- The strong market trend drives an 8.57% rise in QNT’s price and impressive growth.
- Traders benefit from strong momentum as QNT sets the stage for opportunities.
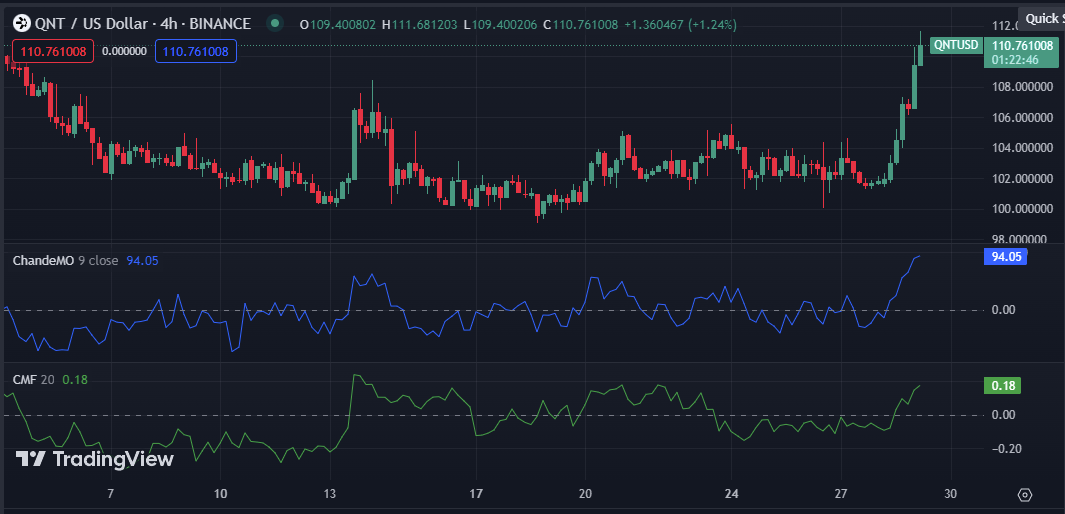
After consolidation around the support level of $101.71, Quant (QNT) price skyrocketed to a 7-day high of $111.35 before facing stiff resistance. As investors eagerly sought to capitalize on the optimistic market conditions, a notable surge in buying activity led to a sudden price increase.
Is everybody in? Is everybody in?
The show is about to begin $QNT pic.twitter.com/VEQiWYXF1b— Asym_Spec (@CryptoChris007) July 28, 2023
The ongoing positive trend in the market resulted in an 8.57% rise in the price of QNT, reaching $110.55 at the time of this writing. Moreover, QNT’s market capitalization and 24-hour trading volume saw significant growth, increasing by 9.46% and 173.05% to $1,335,392,489 and $28,366,027, respectively.
This impressive upswing in both the market value and trading volume of QNT suggests a strong boost in its overall market performance, likely driven by prevailing positive market sentiment.
The Chaikin Money Flow (CMF) value of 0.18 in the QNT market indicates a positive trend, with the line pointing north, signifying favorable future performance for the coin. This positive CMF suggests that more investors buy QNT tokens than selling, resulting in higher capital inflow than outflow.
Similarly, the Chande Momentum Oscillator (ChandeMo) also points north on the 4-hour price chart of the QNT market, boasting a positive value of 94.06. This strong momentum and bullish trend indicate that buyers are taking control, and there is a likelihood of prices rising in the near future.

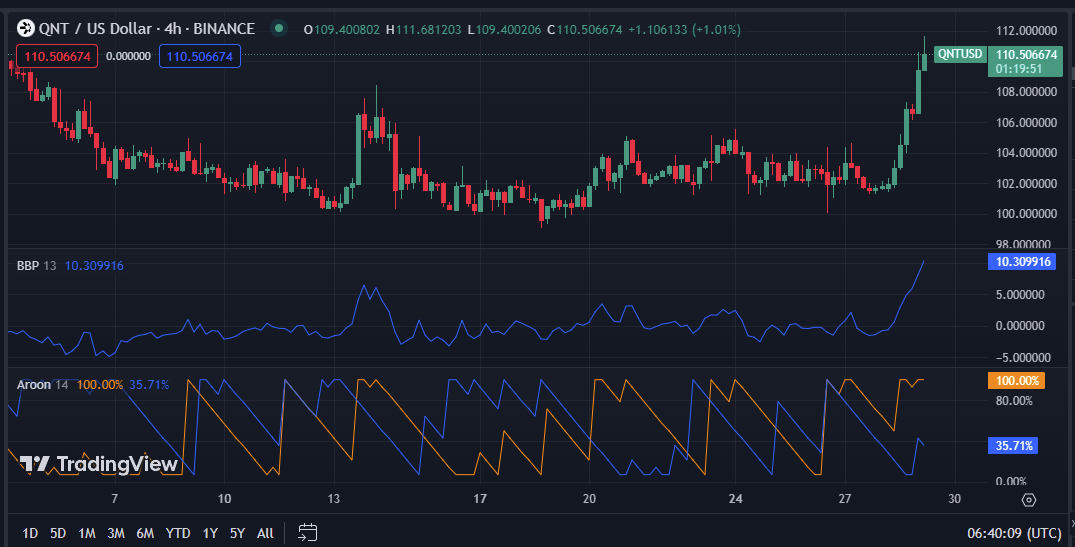
The market’s purchase power is just slightly more than its selling power, according to the Bull Bear Power value of 10.309916. With its increasing trend, the Bull Bear power is assisting traders in making informed decisions and accurately forecasting market patterns, leading to lucrative trades and improving confidence in their investing plans.
On the 4-hour price chart of QNT, the Aroon up and down figures stand at 100.00% and 35.71%, respectively. This movement signifies a strong trend that is likely to persist for some time, despite the possibility of minor reversals, enabling traders to identify potential entry and exit points for their trades precisely.

In conclusion, QNT’s remarkable surge, driven by bullish indicators and positive market sentiment, opens doors to lucrative opportunities in this optimistic market frenzy.
Disclaimer: Cryptocurrency price is highly speculative and volatile and should not be considered financial advice. Past and current performance is not indicative of future results. Always research and consult with a financial advisor before making investment decisions.
- SEO Powered Content & PR Distribution. Get Amplified Today.
- PlatoData.Network Vertical Generative Ai. Empower Yourself. Access Here.
- PlatoAiStream. Web3 Intelligence. Knowledge Amplified. Access Here.
- PlatoESG. Automotive / EVs, Carbon, CleanTech, Energy, Environment, Solar, Waste Management. Access Here.
- BlockOffsets. Modernizing Environmental Offset Ownership. Access Here.
- Source: https://investorbites.com/quant-qnt-price-analysis-29-07/
- :is
- :not
- $UP
- 10
- 100
- 22
- 28
- 8
- 9
- a
- About
- According
- accurately
- activity
- advice
- advisor
- also
- always
- an
- analysis
- and
- ARE
- around
- AS
- assisting
- At
- BE
- Bear
- before
- begin
- benefit
- boasting
- boost
- both
- bull
- Bullish
- buy
- buyers
- Buying
- by
- capital
- capitalization
- capitalize
- Center
- Chart
- Coin
- conclusion
- conditions
- confidence
- considered
- consolidation
- control
- Current
- decisions
- Despite
- doors
- down
- driven
- drives
- eagerly
- enabling
- entry
- Excitement
- Exit
- external
- facing
- favorable
- Figures
- financial
- financial advice
- flow
- For
- frenzy
- from
- fuels
- future
- Growth
- High
- higher
- highly
- HTTPS
- identify
- impressive
- impressive growth
- improving
- in
- Increase
- increasing
- indicates
- Indicators
- informed
- internal
- investing
- investment
- investor
- Investors
- ITS
- just
- leading
- Led
- Level
- likelihood
- likely
- Line
- lucrative
- Making
- Market
- Market Capitalization
- market conditions
- Market News
- market performance
- market sentiment
- market value
- meteoric
- minor
- Momentum
- money
- more
- Moreover
- movement
- Near
- news
- North
- notable
- of
- on
- ongoing
- opens
- opportunities
- Optimistic
- overall
- past
- patterns
- performance
- plans
- plato
- Plato Data Intelligence
- PlatoData
- points
- positive
- possibility
- potential
- power
- precisely
- price
- Price Analysis
- price chart
- Price Increase
- Prices
- purchase
- QNT
- QNT/USD
- Quant
- Quant price analysis
- rally
- reaching
- remarkable
- research
- Resistance
- respectively
- resulting
- Results
- Rise
- rising
- s
- saw
- Selling
- sentiment
- Sets
- should
- show
- significant
- signifies
- Skyrockets
- some
- sought
- Source
- Sparks
- speculative
- Stage
- stand
- strong
- sudden
- Suggests
- support
- support level
- surge
- taking
- than
- that
- The
- The LINE
- their
- There.
- this
- time
- to
- Tokens
- Traders
- trades
- Trading
- trading volume
- TradingView
- Trend
- value
- volatile
- volume
- with
- writing
- zephyrnet


