SNEAK PEAK
- Ripple price analysis shows bearish pressure after a strong sell-off.
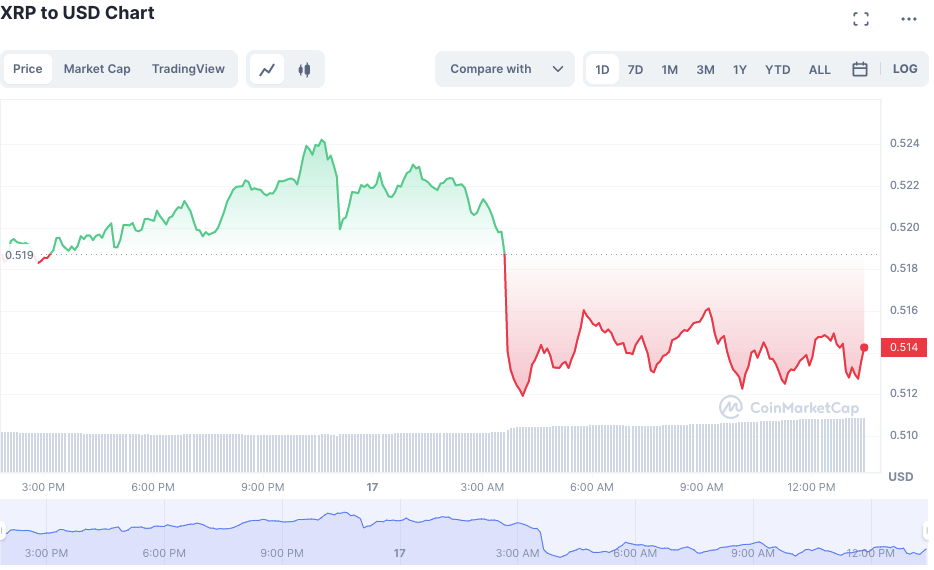
- The XRP is down by more than 1.36% on the day and trading at around $0.5138.
- The resistance level for the cryptocurrency is located at $0.5243.
The Ripple price analysis shows a bearish trend for the XRP as it fell more than 1.36% on the day to close at $0.5138. The crypto was trading in a tight range between $0.5243 and $0.5049 since the previous day but broke below this support level earlier today after seeing a sudden surge in selling pressure.

The market opened today’s session with a bullish momentum at $0.5243, with more buying pressure pushing the XRP toward $0.5287. However, shortly after reaching this level, the bears took control of the market and dragged the price back down.
The bearish pressure has increased since then as more investors started selling off their XRP holdings. The bears are currently targeting lower levels, with a possibility of going beyond the $0.5119 support level if the market continues to be bearish. On the upside, the resistance for XRP is located at $0.5243, which could be tested if the bulls manage to take control of the market again.
The market capitalization for XRP has also dropped by more than 0.97 percent, and it currently stands at around $25.47 billion. The 24-hour trading volume is relatively low, with only $861 billion being traded in the past 24 hours, indicating that the market’s current bearish momentum could continue for some time. The circulating supply of XRP currently stands at around 51 billion tokens.
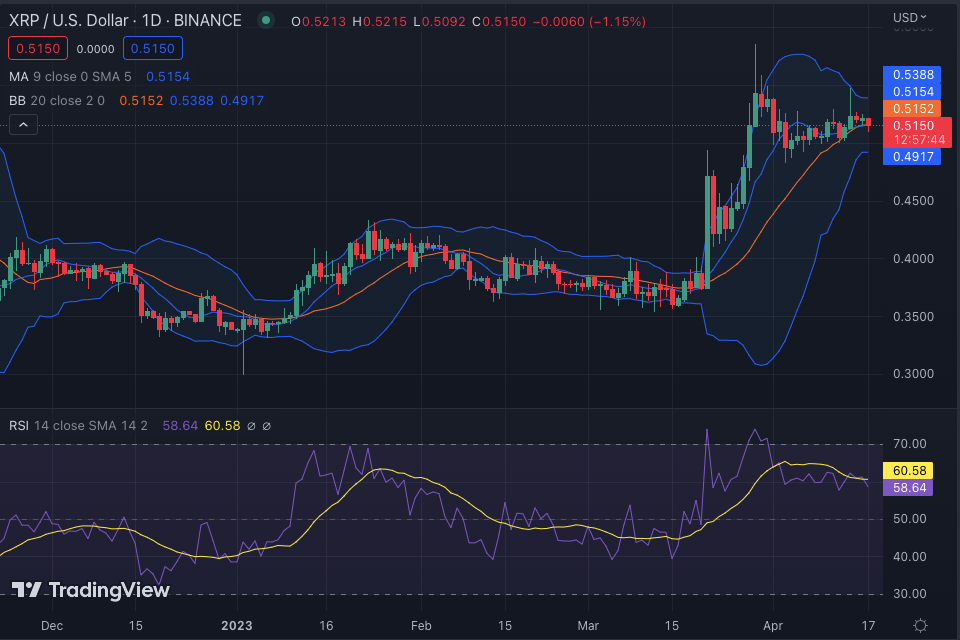
The technical indicators for XRP are also bearish, with the moving average convergence/divergence (MACD) showing a downward trend. The relative strength index(RSI) is also trending downwards at around 55.64, indicating that the bears are still in control of the market. The moving average indicator is currently at $0.5154, with 50 and 200 day averages also trending downwards.

The Volatility in the price of XRP is also high, with Bollinger bands showing an expansion in the price range. The upper Bollinger band is currently located at $0.5388, which may be tested by the bulls if they manage to take control of the market, while the lower band is situated at $0.4917, which could be tested if the bearish momentum continues.
Overall, the XRP price analysis shows bearish pressure after a strong sell-off, and the bears could continue to dominate the market in the near term unless there is a sudden surge in buying pressure from investors. The technical indicators also suggest more bearish pressure in the near term, with a possibility of testing lower levels if this trend continues. However, if the bulls manage to take control of the market, then the XRP may push back above the $0.5243 resistance level.
Disclaimer: Cryptocurrency price is highly speculative and volatile, and should not be considered financial advice. Past and current performance is not indicative of future results. Always do your own research and consult with a financial advisor before making investment decisions.
- SEO Powered Content & PR Distribution. Get Amplified Today.
- Platoblockchain. Web3 Metaverse Intelligence. Knowledge Amplified. Access Here.
- Minting the Future w Adryenn Ashley. Access Here.
- Source: https://investorbites.com/ripple-price-analysis-17-04/
- :is
- 1
- a
- above
- advice
- advisor
- After
- always
- analysis
- and
- ARE
- around
- AS
- At
- average
- back
- BAND
- BE
- bearish
- Bearish Momentum
- Bears
- before
- being
- below
- between
- Beyond
- Billion
- Billion tokens
- Bollinger bands
- Broke
- Bullish
- Bulls
- Buying
- by
- cap
- capitalization
- Chart
- circulating
- Close
- Coin
- Coin Market Cap
- considered
- continue
- continues
- control
- could
- crypto
- cryptocurrency
- Cryptocurrency Price
- Current
- Currently
- daily
- day
- decisions
- Dominate
- down
- downward
- dropped
- Earlier
- expansion
- external
- financial
- financial advice
- For
- from
- future
- going
- High
- highly
- Holdings
- HOURS
- However
- HTTPS
- in
- increased
- Indicator
- Indicators
- internal
- investment
- Investors
- IT
- Level
- levels
- located
- Low
- MACD
- Making
- manage
- Market
- Market Cap
- Market Capitalization
- Market News
- May..
- Momentum
- more
- moving
- moving average
- Near
- news
- of
- on
- opened
- own
- past
- percent
- performance
- plato
- Plato Data Intelligence
- PlatoData
- possibility
- pressure
- previous
- price
- Price Analysis
- price chart
- Push
- push back
- Pushing
- range
- reaching
- relatively
- research
- Resistance
- Results
- Ripple
- Ripple News
- ripple price
- Ripple Price Analysis
- rsi
- seeing
- sell-off
- Selling
- session
- Shortly
- should
- Shows
- since
- some
- stands
- started
- Still
- strength
- Strikes
- strong
- sudden
- supply
- support
- support level
- surge
- Take
- targeting
- Technical
- Testing
- that
- The
- their
- time
- to
- today
- today’s
- Tokens
- toward
- traded
- Trading
- trading volume
- TradingView
- Trend
- trending
- Upside
- volatile
- Volatility
- volume
- which
- while
- with
- xrp
- XRP/USD
- Your
- zephyrnet


