Secret and Beefy Finance are yet to break away from the bear grip of June. Nonetheless, there is hope if BIFI/USDT is firm above $950. On the other hand, a close above $1.3 will open doors for SCRT/USDT buyers.
Secret (SCRT)
Out of this platform, developers can build secret dApps which can find application in many sectors, especially in DeFi. SCRT token is the main currency of this privacy-preserving protocol.
Past Performance of SCRT
SCRT prices are heavily fluctuating, as visible in the daily chart.
There could be some improvement in momentum and volatility, but SCRT is still clipped on the upside.
Currently, SCRT is stable, losing two percent and struggling for higher highs, although accompanying trading volume is relatively high.
Day-Ahead and what to Expect
SCRT/USDT remains bearish provided the 20-day moving average is a strong liquidation line.
On the downside, $1 is a psychological round number and critical support. On the upper end, the middle BB is a flexible resistance line.
However, June 21 highs at $1.3 remain a level of interest from an Effort-versus-Results perspective.
A buy trigger, if broken, SCRT may find the momentum to reach $2—or better.
SCRT/USDT Technical Analysis
Prices are in a tight trading range, capped at $1 and $1.3 in the short term.
As SCRT bulls try to shake off sellers, $1.3 and the middle BB must be broken for any chance of buy trend continuation, with targets at $2.3—March and April 2021 lows.
Losses below $1 cancel the uptrend.
Beefy Finance (BIFI)
This is a cross-chain yield aggregating platform that launched first in the Binance Smart Chain (BSC). BIFI is the governance token.
Past Performance of BIFI
Since listing, BIFI bears have had the better of bulls if price action in the daily chart leads.
At the time of writing, BIFI is down two percent, reflecting the price action of mid-June 2021.
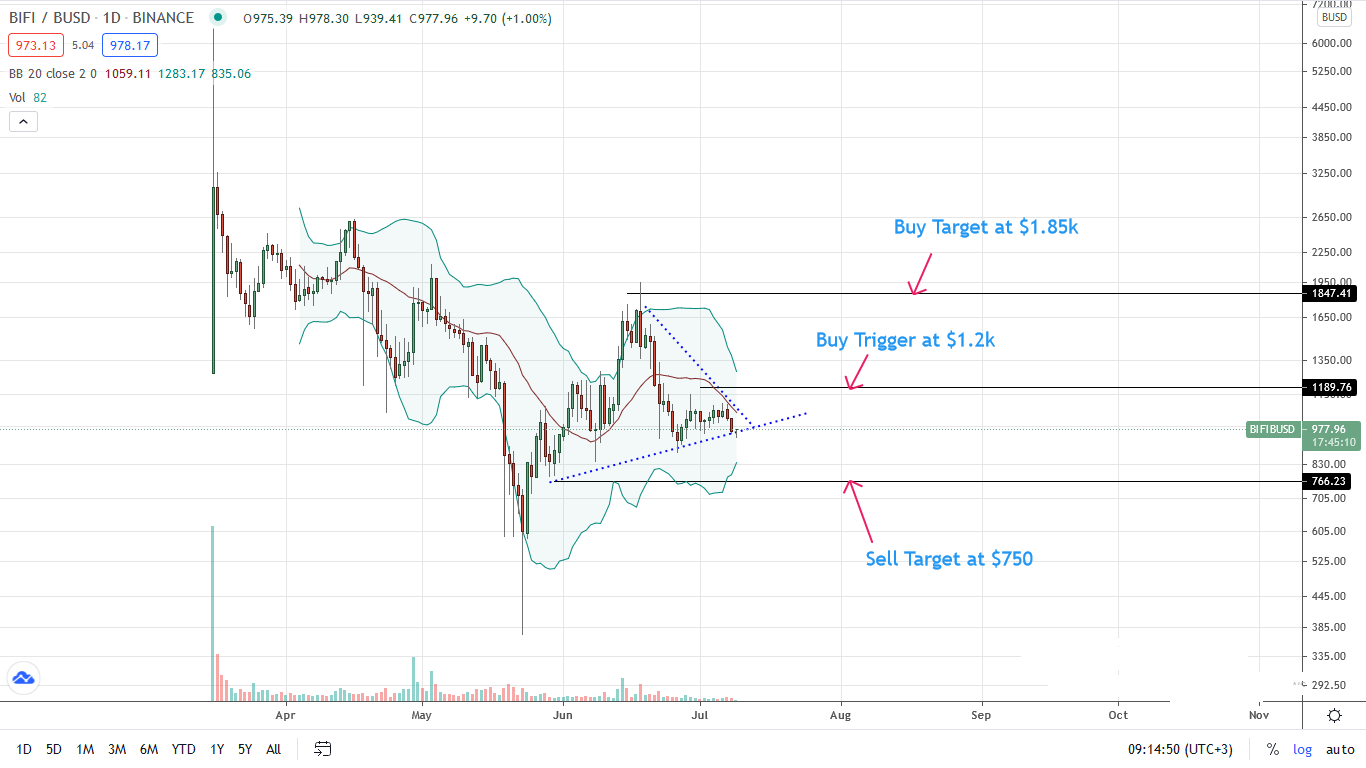
Overly, BIFI/BUSD prices are inside a descending wedge.
Day-Ahead and What to Expect
BIFI prices remain in range, printing lower lows with resistance at $1.2k and support at around $950. A clear trend will be defined if BIFI/BUSD closes in either direction in a revival or bear trend continuation.
BIFI/BUSD Technical Analysis
Although DeFi traders are confident, bears are putting brakes on any form of price gains. Resistance remains at the middle BB and $1.2k.
If BIFI buyers close above these levels, prices will quickly tear up to June 2021 highs of around $1.85k.
On the flip side, it could be more sour grapes if BIFI melts below the minor support trend line and $950k. Therein, prices could collapse to as low as $750.
- "
- 2K
- 9
- Action
- active
- analysis
- Application
- April
- around
- bearish
- Bears
- binance
- border
- build
- Bulls
- buy
- Currency
- DApps
- data
- DeFi
- developers
- DLT
- Figure
- finance
- Firm
- First
- form
- governance
- High
- HTTPS
- interest
- IT
- July
- Level
- Line
- Liquidation
- listing
- Momentum
- open
- Other
- performance
- perspective
- platform
- Posts
- price
- range
- Sectors
- Sellers
- sharding
- Short
- smart
- support
- Technical
- Technical Analysis
- time
- token
- Traders
- Trading
- Volatility
- volume
- writing
- Yield


