Published 6 hours ago
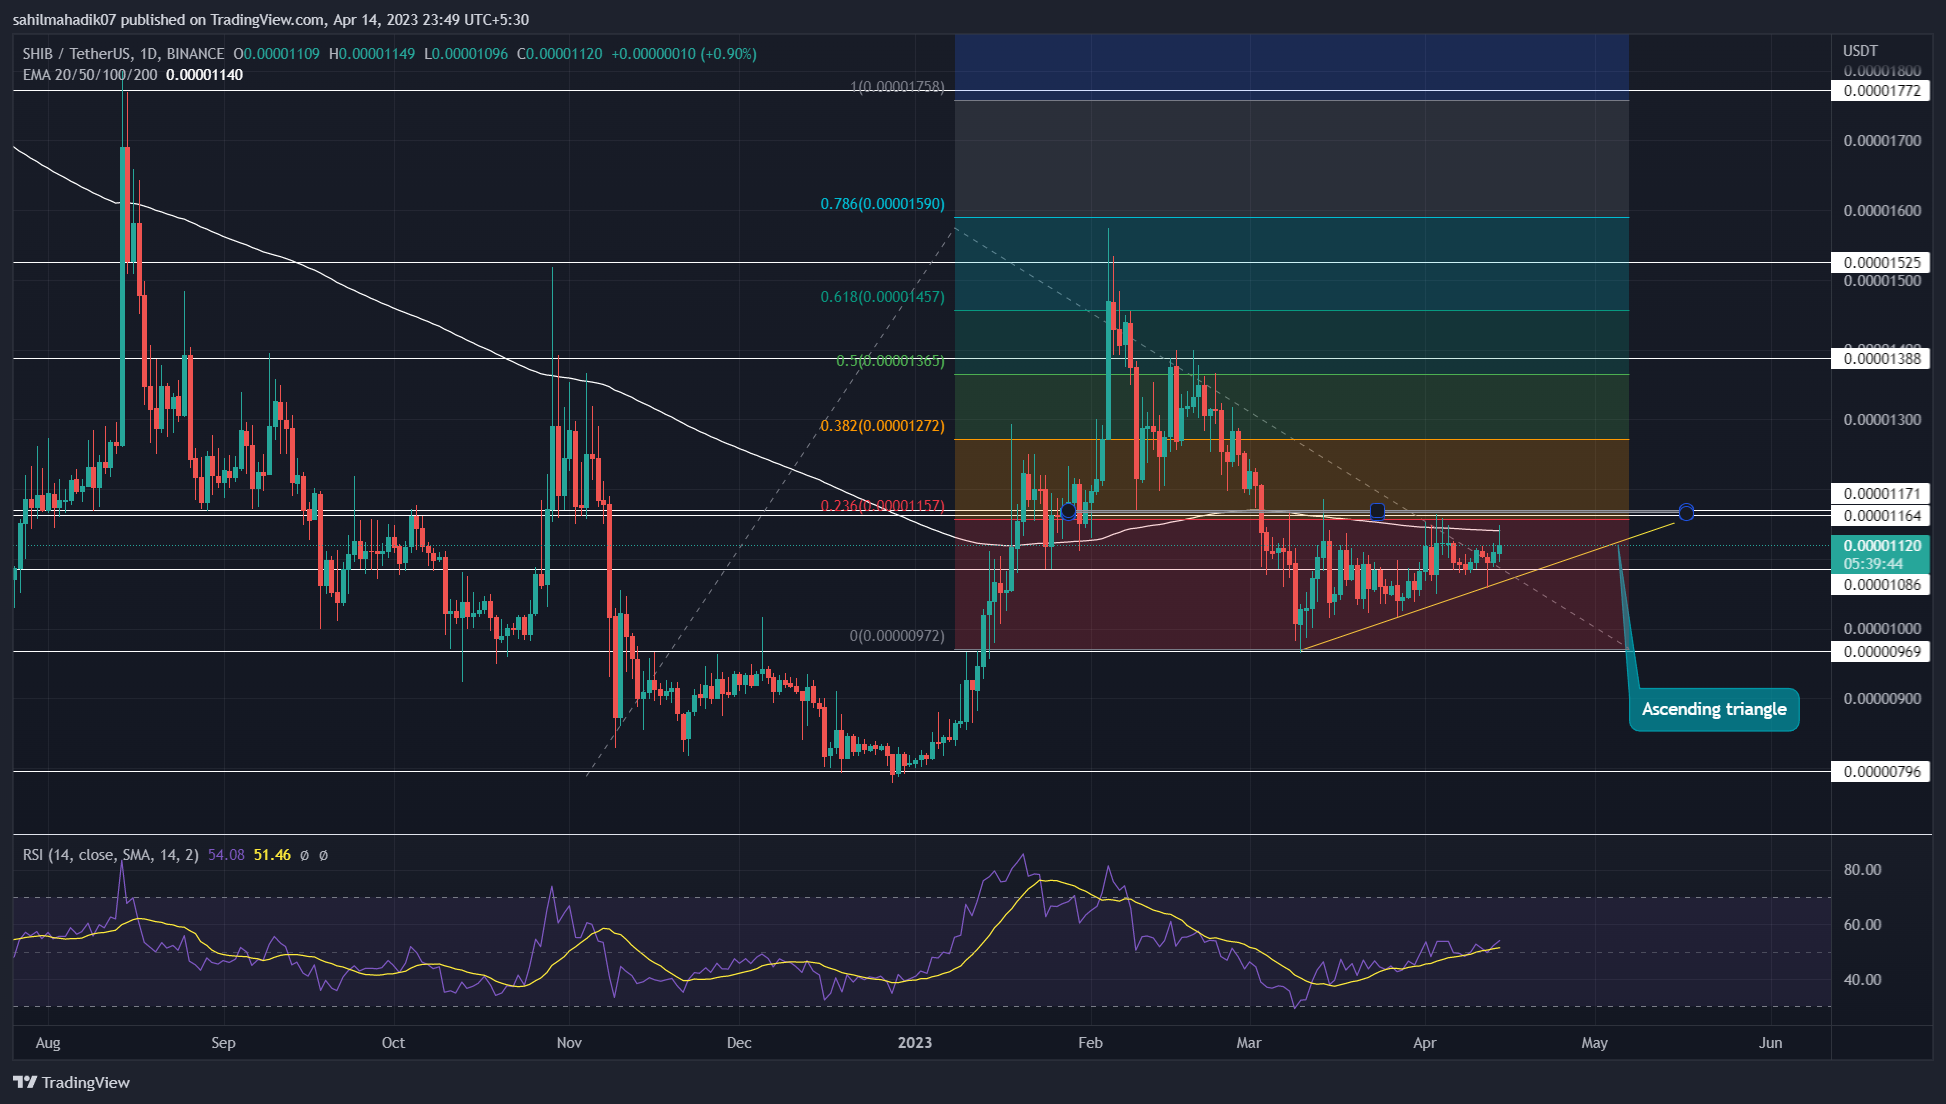
SHIB Price Prediction: The ongoing consolidation in Shiba Inu price revealed the formation of an ascending triangle pattern in the daily time frame chart. This pattern is one of the famous bullish continuation patterns that offer a significant upswing upon the breakout of its neckline resistance. Within the pattern, the formation of a higher low indicates a gradual increase in bullish momentum which would encourage buyers to take trend control.
advertisement
Key Points:
- A bullish breakout from the $0.000017 resistance encourages the Shiba Inu price for a 20% rally
- A bullish divergence in daily RSI increases the possibility of an uptrend resumption
- The intraday trading volume of the Shiba Inu coin is $288 Million, showing a 66% gain.

 Source- Tradingview
As of now, the Shiba Inu coin price trades at $0.00001104 and continues to resonate with the key barriers of the ascending triangle pattern. The daily candles with the triangle showing multiple short bodies and high wicks indicate uncertainty among market participants.
Thus, the potential traders can consider the areas between the range as a no-trading zone and after a price breakout. With a high possibility, the SHIB price is more likely to breach the $0.0000117 resistance and trigger the triangle.
Trending Stories
A daily candle closing above the aforementioned resistance will accelerate the bulling pressure and surge the prices 20% higher to reach $0.00001388.
Also Read: What Is Regenerative Finance (Refi) And Who Is It For?
Moreover, this breakout will signal the prices will continue the prior recovery phase and mark the $0.0000097 as a higher low. Concerning this new low, the Fibonacci trend base indicator suggests the potential bull run could reach a 100% FIB level of $0.0000177.
On a contrary note, a breakdown below the support trendline will invalidate the bullish thesis.
Technical indicator
Relative strength index: Despite a sideways price trend, an evident growth in the daily RSI slope indicates the underlying bullish momentum is rising and a higher possibility for a $0.000017 breakout.
EMAs: the flattish EMAs(20, 50, 100, and 200) accentuates a sideways trend.
Shiba Inu Price Intraday Levels
- Spot price: $0.0000115
- Trend: Bullish
- Volatility: High
- Resistance levels- $0.0000117 and $0.0000125
- Support levels: $0.00001028 and $0.0000097
Share this article on:
advertisement
The presented content may include the personal opinion of the author and is subject to market condition. Do your market research before investing in cryptocurrencies. The author or the publication does not hold any responsibility for your personal financial loss.
<!– Close Story–>
- SEO Powered Content & PR Distribution. Get Amplified Today.
- Platoblockchain. Web3 Metaverse Intelligence. Knowledge Amplified. Access Here.
- Minting the Future w Adryenn Ashley. Access Here.
- Source: https://coingape.com/markets/shib-price-prediction-shiba-inu-price-sets-stage-52-rally-bullish-pattern-emerged/
- :is
- 1
- 10
- 100
- 7
- 8
- 9
- a
- above
- accelerate
- Ad
- After
- among
- and
- areas
- article
- AS
- At
- author
- avatar
- banner
- barriers
- base
- Beauty
- before
- below
- between
- blockchain
- breach
- Breakdown
- breakout
- Brian
- bull
- Bull Run
- Bullish
- bullish divergence
- buyers
- CAN
- Candles
- Chart
- closing
- Coin
- Coingape
- COM
- condition
- Consider
- consolidation
- content
- continuation
- continue
- continues
- contrary
- control
- could
- cryptocurrencies
- cryptocurrency
- daily
- Despite
- different
- Divergence
- emerged
- encourage
- encourages
- Entertainment
- famous
- Fashion
- Fibonacci
- finance
- financial
- follow
- For
- formation
- FRAME
- from
- Gain
- gradual
- Growth
- Have
- High
- higher
- hold
- HOURS
- HTTPS
- i
- in
- include
- Including
- Increase
- Increases
- index
- indicate
- indicates
- Indicator
- Inu
- investing
- IT
- ITS
- journalism
- jpg
- Key
- Last
- Level
- levels
- likely
- loss
- Low
- mark
- Market
- market research
- May..
- million
- Momentum
- more
- multiple
- New
- of
- offer
- on
- ONE
- ongoing
- Opinion
- participants
- past
- Pattern
- patterns
- personal
- phase
- plato
- Plato Data Intelligence
- PlatoData
- plugin
- points
- possibility
- potential
- prediction
- presented
- pressure
- price
- Price Prediction
- Prices
- Prior
- Publication
- rally
- range
- reach
- Read
- recovery
- ReFi
- regenerative
- Regenerative Finance
- research
- Resistance
- Resonate
- responsibility
- Revealed
- rising
- rsi
- Run
- Sets
- Share
- SHIB
- SHIB Price
- Shiba
- Shiba Inu
- Shiba Inu Coin
- Shiba Inu Price
- Short
- sideways
- Signal
- significant
- Stage
- strength
- subject
- Suggests
- support
- surge
- Take
- that
- The
- time
- to
- Topics
- Traders
- trades
- Trading
- trading volume
- TradingView
- Trend
- trending
- trigger
- Uncertainty
- underlying
- uptrend
- variety
- volume
- which
- WHO
- will
- with
- within
- working
- would
- written
- years
- Your
- zephyrnet


