Published 31 mins ago
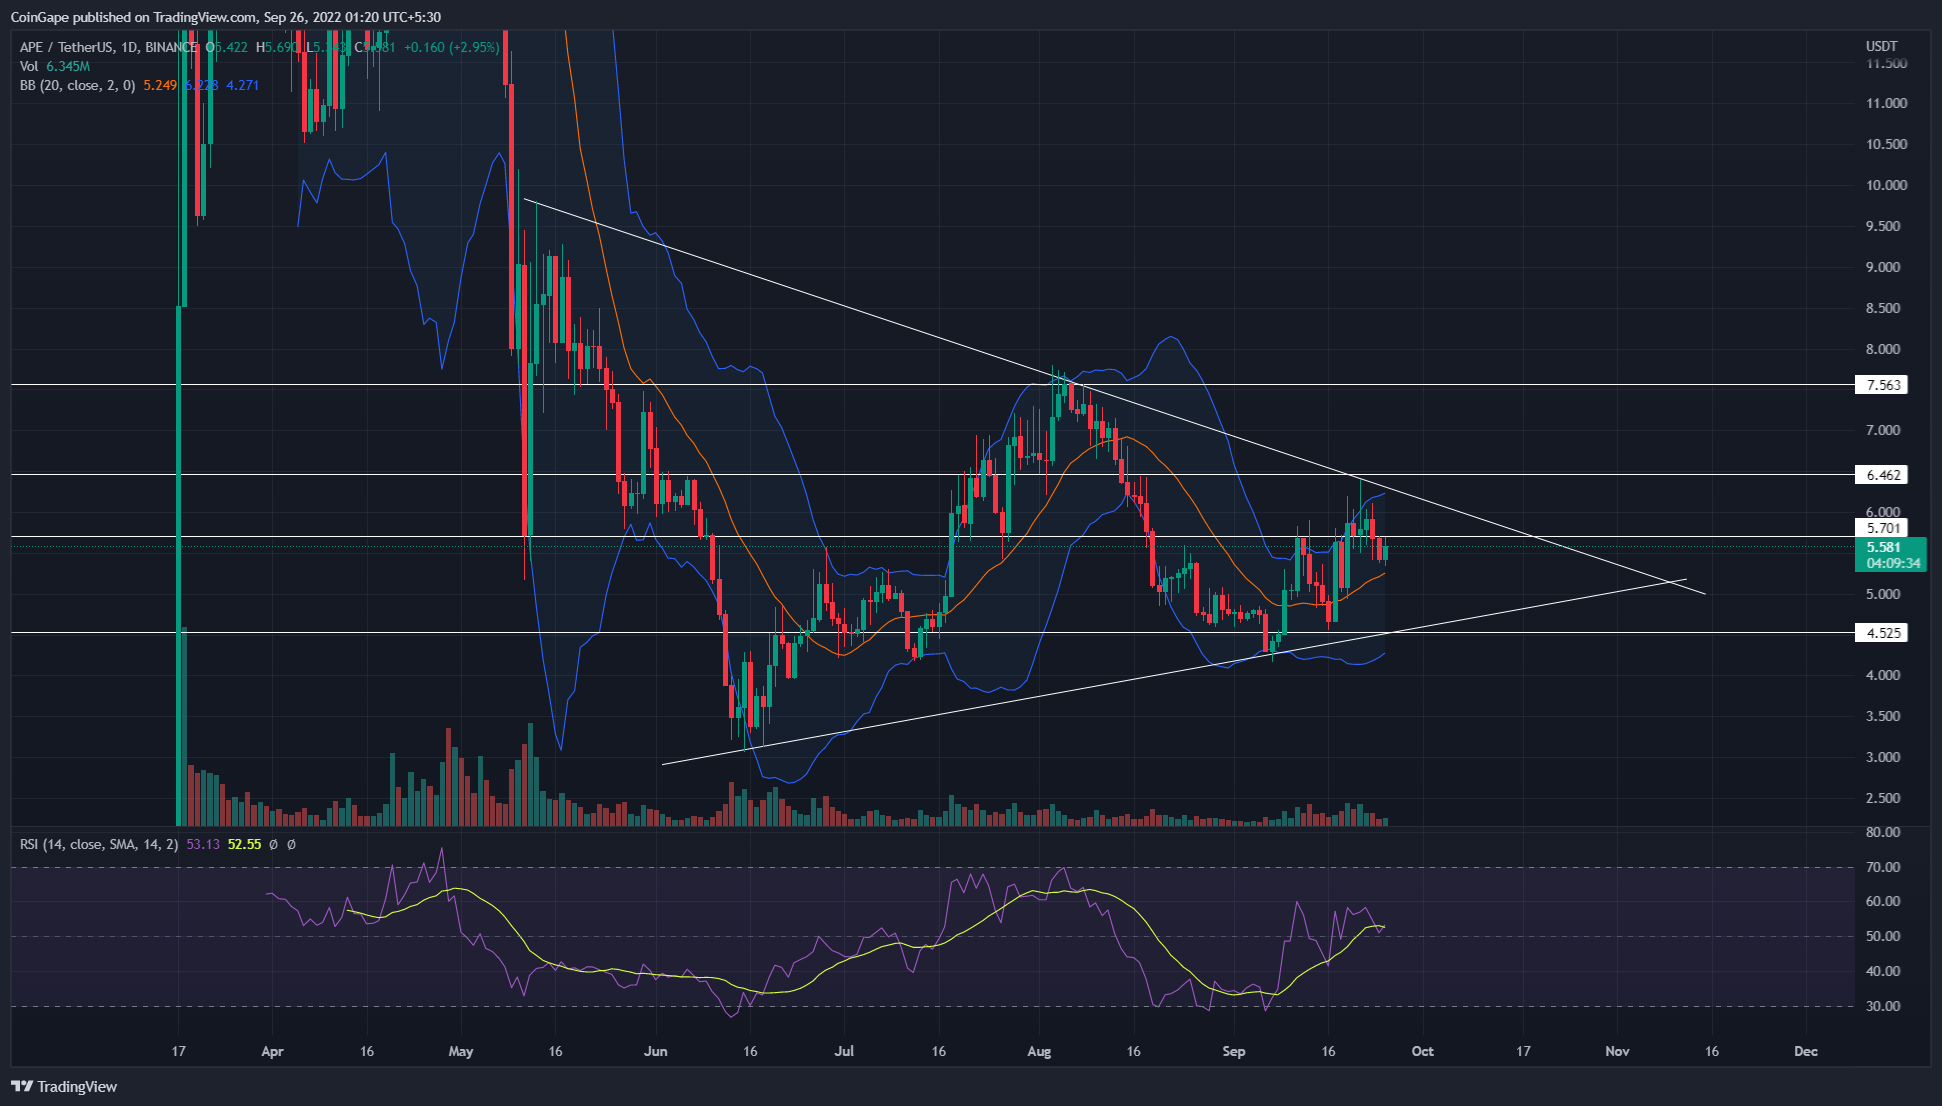
In our previous Apecoin price analysis, we accounted for the formation of an inverted pennant pattern and how it will influence the coin’s future price. Currently, the coin price trades at the $5.6 mark and indicates an intraday growth of 4.26%. The altcoin’s recent reversal from the resistance trendline means ongoing consolidation will last for a few more sessions.
advertisement
Key points:
- The APE price breakdown from $5.7 will encourage an 18.5% drop
- However, a Low high retest to the breached $5.7 support suggest weakness in bearish momentum
- The intraday trading volume in Apecoin is $213.2 Million, indicating a 4.78% gain

 Source- Tradingview
Under the influence of an inverted pennant pattern, the Apecoin price travels in a sideways rally within the two converging trendlines. On September 21st, the coin price retested the resistance trendline, replenishing the bearish momentum.
Moreover, earlier this week, the daily chart showcased several higher price rejections at this level, indicating high supply pressure. As a result, the Apecoin price reverted from this trendline, initiating a new bear cycle within the triangle pattern.
Trending Stories
Also read: Just-In: Horizen Announces Final Date For ApeCoin Staking, APE Price Jumps
Furthermore, the bearish reversal gave a strong breakdown from the local support zone of $5.7. Today, the altcoin is bullish and retests the breached support as potential resistance. If the sellers sustain the prices below $5.7, the prices will extend the ongoing consolidation and plunge prices to the support trendline.
In theory, Apecoin should eventually break the bottom trendline to resume its prior downfall.
On a contrary note, if the coin buyers manage to break the above trendline, the market participants may witness a new recovery rally.
Thus, the Apecoin prices wobble in a no-trading zone, and new buyers should wait for a pattern breakout before entering the market.
Technical Indicator
RSI: the daily-RSI slope maintain above the midline indicates the market sentiment is bullish
advertisement
Bollinger band indicator: the coin price could obtain sufficient from the indicator’s midline and extend the bullish trend.
Apecoin Price Intraday Levels
- Spot rate: $5.58
- Trend: Bullish
- Volatility: High
- Resistance levels: $5.7 and $6.46
- Support levels: $4.5 and $3.2
Share this article on:
The presented content may include the personal opinion of the author and is subject to market condition. Do your market research before investing in cryptocurrencies. The author or the publication does not hold any responsibility for your personal financial loss.
- ApeCoin
- apecoin price analysis
- Bitcoin
- blockchain
- blockchain compliance
- blockchain conference
- coinbase
- Coingape
- coingenius
- Consensus
- crypto conference
- crypto mining
- cryptocurrency
- decentralized
- DeFi
- Digital Assets
- ethereum
- machine learning
- non fungible token
- plato
- plato ai
- Plato Data Intelligence
- Platoblockchain
- PlatoData
- platogaming
- Polygon
- Price Analysis
- proof of stake
- W3
- zephyrnet


