SNEAK PEEK
- Shiba Inu price analysis shows a slightly bearish trend in the past few hours.
- SHIB/USD is currently trading at $0.00000830, down by 1.12 percent.
- Cryptocurrency is facing a strong rejection at the $0.000008688 level.
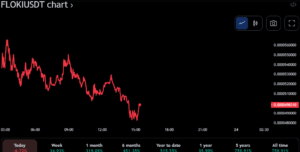
Today’s Shiba Inu price analysis indicates a bearish trend in the market after bulls failed to hold the $0.000008600 level. The SHIB market opened a trading section trading in bullish territory at $0.00000830 and moved up to a high of $0.000008476; however, the bulls soon lost their grip, and the price started declining. SHIB/USD is currently trading at $0.00000830, down by 1.12 percent in the past few hours.
The bulls face strong resistance at the $0.000008688 level, the previous high before the bears stepped in. A successful break above this level could open up further upside towards $0.00000900 and possibly even higher levels. On the other hand, if the bulls fail to push the price above this resistance, a bearish trend may continue, and SHIB/USD might drop to $0.00000800 or lower soon.
The trading sideways trend in the SHIB market could also be attributed to the lack of buying pressure and recent investor uncertainties, which have led to a decrease in trading activities. The bulls and bears are now locked in a tug of war, with neither side getting the upper hand as the price fluctuates between support and resistance levels.
The market capitalization of Shiba Inu currently stands at $4.88 billion, with a decrease of 1.26 percent in the past 24 hours, indicating a lack of buying pressure. However, the trading volume shows signs of recovery as it jumped up to $182 million in the past 24 hours, which could be a sign of an incoming trend reversal. The circulating supply of SHIB currently stands at 589,346,914,631,298 SHIB.
Looking at technical indicators, the 20-EMA is trading on a bearish trend as it recently crossed below the 50-EMA, indicating that selling pressure dominates the market. The MACD line also trades downward and has entered negative territory, confirming a bearish trend in the Shiba Inu market. The 20-SMA is currently trading parallel to the 50-SMA, highlighting a consolidation phase in the market.
The Bollinger bands on the 4-hour SHIB chart are narrowing, indicating reduced volatility in the market. This could signify accumulation before a bullish breakout as buyers accumulate coins at lower levels. The upper Bollinger band is currently at $0.00000863, while the lower Bollinger band is trading at $0.00000814; a break above or below either of these levels could indicate an incoming trend reversal.
The overall market sentiments for Shiba Inu remain bearish, with the bulls and bears in a tug of war. The support level at $0.000008238 could become a crucial pivot point soon; a break below this level could push SHIB/USD towards $0.000008000 or lower, while a successful break above the resistance at $0.000008688 could open up further upside potential for investors to capitalize on.
Disclaimer: Cryptocurrency price is highly speculative and volatile and should not be considered financial advice. Past and current performance is not indicative of future results. Always research and consult with a financial advisor before making investment decisions.
- SEO Powered Content & PR Distribution. Get Amplified Today.
- PlatoData.Network Vertical Generative Ai. Empower Yourself. Access Here.
- PlatoAiStream. Web3 Intelligence. Knowledge Amplified. Access Here.
- PlatoESG. Automotive / EVs, Carbon, CleanTech, Energy, Environment, Solar, Waste Management. Access Here.
- BlockOffsets. Modernizing Environmental Offset Ownership. Access Here.
- Source: https://investorbites.com/shiba-inu-shib-price-analysis-01-08/
- :has
- :is
- :not
- $UP
- 1
- 12
- 20
- 22
- 24
- 26%
- 8
- a
- above
- Accumulate
- accumulation
- activities
- advice
- advisor
- After
- also
- always
- an
- analysis
- and
- ARE
- AS
- At
- BAND
- BE
- bearish
- Bears
- become
- before
- below
- between
- Billion
- Bollinger bands
- Break
- breakout
- Bullish
- Bulls
- buyers
- Buying
- by
- capitalization
- capitalize
- Chart
- circulating
- Coins
- considered
- consolidation
- continue
- could
- Crossed
- crucial
- crypto
- cryptocurrency
- Cryptocurrency Price
- Current
- Currently
- decisions
- Declining
- decrease
- dominates
- down
- downward
- Drop
- either
- entered
- Even
- Face
- facing
- FAIL
- Failed
- few
- financial
- financial advice
- fluctuates
- For
- For Investors
- further
- future
- getting
- hand
- Have
- High
- higher
- highlighting
- highly
- hold
- HOURS
- However
- HTTPS
- if
- in
- Incoming
- indicate
- indicates
- Indicators
- internal
- Inu
- investment
- investor
- Investors
- IT
- Jumped
- Lack
- Led
- Level
- levels
- Line
- locked
- lost
- lower
- MACD
- Making
- Market
- Market Capitalization
- Market News
- May..
- might
- million
- most
- moved
- negative
- negative territory
- Neither
- news
- now
- of
- on
- open
- opened
- or
- Other
- overall
- Parallel
- past
- percent
- performance
- phase
- Pivot
- Plague
- plato
- Plato Data Intelligence
- PlatoData
- Point
- possibly
- potential
- pressure
- previous
- price
- Price Analysis
- Push
- recent
- recently
- recovery
- Reduced
- remain
- research
- Resistance
- Results
- Reversal
- reviewing
- Section
- Seek
- Selling
- SHIB
- SHIB Price
- SHIB/USD
- Shiba
- Shiba Inu
- Shiba Inu News
- Shiba Inu Price
- shiba inu price analysis
- should
- Shows
- side
- sideways
- sign
- signify
- Signs
- soon
- speculative
- Stability
- stands
- started
- strong
- successful
- supply
- support
- support level
- Technical
- territory
- that
- The
- their
- These
- this
- to
- towards
- trades
- Trading
- trading volume
- Trend
- Trends
- uncertainties
- unpredictable
- Upside
- volatile
- Volatility
- volume
- war
- What
- What is
- which
- while
- with
- zephyrnet


