SNEAK PEEK
- Massive whale transfers spark speculation on SHIB’s future amid bear dominance.
- SHIB market reacts to gigantic whale’s transfer, raising questions on diversification.
- Bearish pressure persists as massive SHIB whale transfer leaves investors intrigued.
A gigantic whale holding 101.47T SHIB ($756M), or 10.15% of the total supply, likely the largest holder, transferred 4T SHIB ($29.8M) to eight new addresses. It has been 610 days since the whale last made a sizable transfer. This abrupt shift suggests that the whale may be attempting to diversify its holdings or alter its investment approach.
A giant whale with 101.47T $SHIB($756M, 10.15% of the total supply, probably the largest holder) transferred 4T $SHIB ($29.8M) to 8 fresh addresses today.
The whale has not made any large transfers for 610 days.https://t.co/3yewExpQa4 pic.twitter.com/LvVCKVnrSJ
— Lookonchain (@lookonchain) July 13, 2023
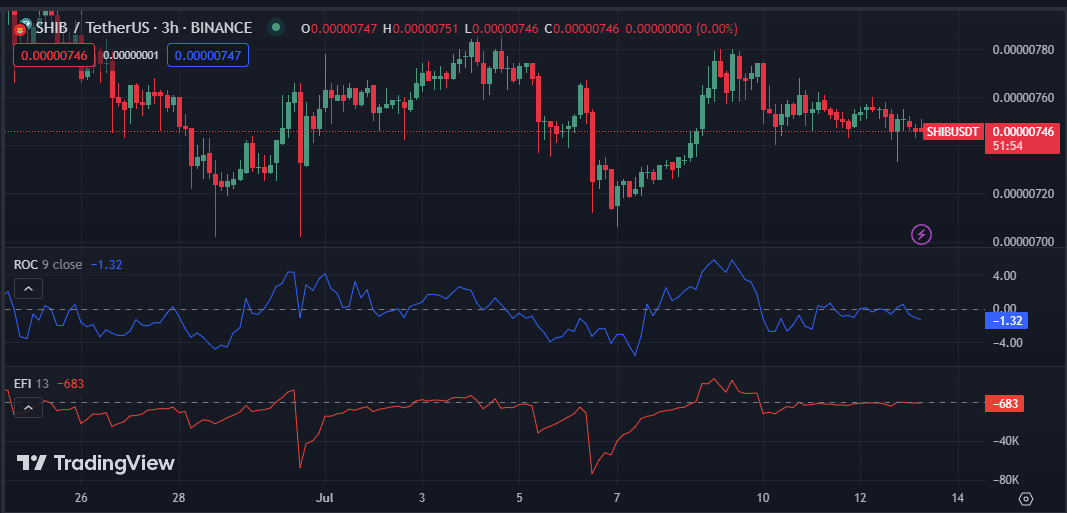
Given that it hasn’t made any big moves in more than 610 days, the whale’s latest behavior is intriguing, and one wonders what it has in mind for the future. During these transactions, bears dominated the SHIB market, driving prices to an intraday low of $0.000007375, despite bulls’ attempts to reach an intraday high of $0.000007595. Due to persistent bearish pressure, SHIB’s price had fallen from 1.29% during this writing to $0.000007495.
During the recession, SHIB experienced a 1.28% decline in market capitalization, reaching $4,417,272,472. However, there was a notable 11.63% increase to $73,926,862 in the 24-hour trading volume, suggesting significant ongoing interest in SHIB. Investors and traders actively engage in transactions and seek opportunities amid the market’s unstable state.
With a Rate of Change (ROC) of -1.32, the market exhibits significant negative momentum, which could result in further declines if price action breaches key support levels. If, on the other hand, the ROC rating improves and advances into positive territory, this may indicate an increase in buying opportunities and a change in the traders’ momentum.
The Elder Force Index (EFI) for the 3-hour price chart of the SHIB market is negative, with a value of -683k, indicating an increase in selling pressure and the beginning of an adverse trend. Even if SHIB continues to decline, a significant price increase will likely happen.

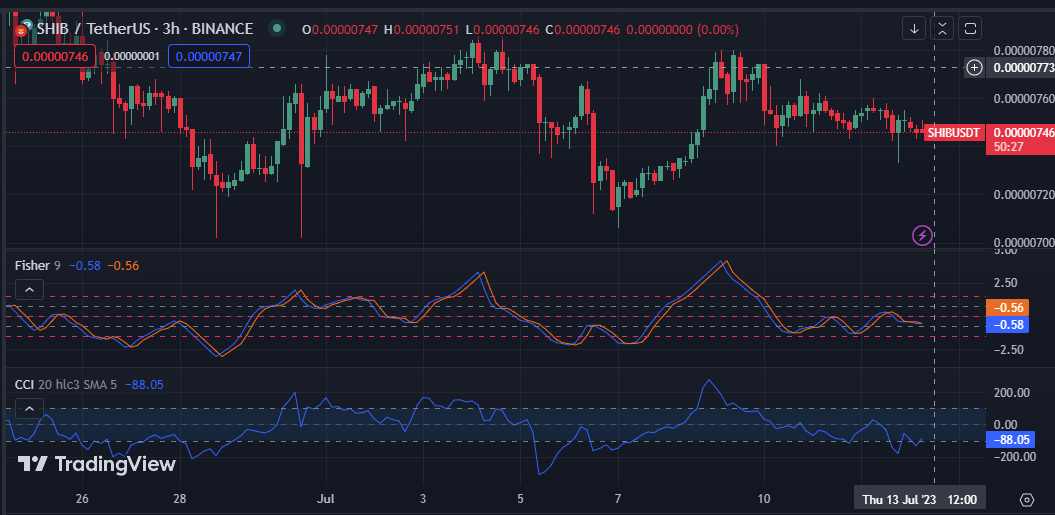
The Fisher Transform value of -0.58 on the 3-hour price chart for the SHIB market is negative and below the signal line. This action indicates an increase in selling pressure. Therefore, traders may consider going short or delaying the opening of long positions until a possible trend reversal occurs.
On the 3-hour price chart for SHIB, the negative Commodity Channel Index (CCI) with its line pointing south has a value of -88.05. This pattern suggests that the SHIB market is experiencing intense selling pressure and that a price reversal is imminent.

In conclusion, the giant whale transfer sparks speculation in the bearish SHIB market, leaving investors intrigued. The future direction remains uncertain amid price fluctuations.
Disclaimer: Cryptocurrency price is highly speculative and volatile and should not be considered financial advice. Past and current performance is not indicative of future results. Always research and consult with a financial advisor before making investment decisions.
- SEO Powered Content & PR Distribution. Get Amplified Today.
- PlatoData.Network Vertical Generative Ai. Empower Yourself. Access Here.
- PlatoAiStream. Web3 Intelligence. Knowledge Amplified. Access Here.
- PlatoESG. Automotive / EVs, Carbon, CleanTech, Energy, Environment, Solar, Waste Management. Access Here.
- BlockOffsets. Modernizing Environmental Offset Ownership. Access Here.
- Source: https://investorbites.com/shiba-inu-shib-price-analysis/
- :has
- :is
- :not
- 1
- 10
- 11
- 13
- 15%
- 20
- 22
- 32
- 610
- 8
- a
- Action
- actively
- addresses
- advances
- adverse
- advice
- advisor
- always
- Amid
- an
- analysis
- and
- any
- approach
- AS
- attempting
- Attempts
- BE
- Bear
- bearish
- been
- before
- Beginning
- behavior
- below
- Big
- breaches
- Buying
- capitalization
- Center
- change
- Channel
- Chart
- commodity
- conclusion
- Consider
- considered
- continues
- could
- Current
- Days
- decisions
- Decline
- Declines
- Despite
- direction
- diversification
- diversify
- Dominance
- driving
- due
- during
- elder
- engage
- Even
- exhibits
- experienced
- experiencing
- external
- Fallen
- financial
- financial advice
- fluctuations
- For
- Force
- fresh
- from
- further
- future
- giant
- going
- had
- hand
- happen
- High
- highly
- holder
- holding
- Holdings
- However
- HTTPS
- if
- ignites
- imminent
- in
- Increase
- index
- indicate
- indicates
- interest
- internal
- into
- intriguing
- Inu
- investment
- investor
- Investors
- IT
- ITS
- Key
- large
- largest
- Last
- latest
- leaving
- levels
- likely
- Line
- Long
- Low
- made
- Making
- Market
- Market Capitalization
- Market News
- massive
- May..
- mind
- Momentum
- more
- moves
- negative
- New
- news
- notable
- of
- on
- ONE
- ongoing
- opening
- opportunities
- or
- Other
- past
- Pattern
- performance
- persists
- plato
- Plato Data Intelligence
- PlatoData
- positions
- positive
- possible
- pressure
- price
- PRICE ACTION
- Price Analysis
- price chart
- Price Fluctuations
- Price Increase
- Prices
- probably
- Questions
- raising
- Rate
- rating
- reach
- reaching
- Reacts
- recession
- remains
- research
- result
- Results
- Reversal
- Seek
- Selling
- SHIB
- shib whale
- Shiba
- Shiba Inu
- Shiba Inu News
- Shiba Inu Price
- shiba inu price analysis
- shift
- Short
- should
- Signal
- significant
- since
- sizable
- Source
- South
- Spark
- Sparks
- speculation
- speculative
- State
- Suggests
- supply
- support
- support levels
- territory
- than
- that
- The
- The Future
- There.
- therefore
- These
- this
- to
- today
- Total
- Traders
- Trading
- trading volume
- TradingView
- Transactions
- transfer
- transferred
- transfers
- Transform
- Trend
- Uncertain
- until
- value
- volatile
- volume
- was
- Whale
- What
- which
- will
- with
- writing
- zephyrnet


